

Multi-platform whole-genome microarray analyses refine the epigenetic signature of breast cancer metastasis with gene expression and copy number
- PMID: 20084286
- PMCID: PMC2801616
- DOI: 10.1371/journal.pone.0008665
Multi-platform whole-genome microarray analyses refine the epigenetic signature of breast cancer metastasis with gene expression and copy number
Abstract
Background: We have previously identified genome-wide DNA methylation changes in a cell line model of breast cancer metastasis. These complex epigenetic changes that we observed, along with concurrent karyotype analyses, have led us to hypothesize that complex genomic alterations in cancer cells (deletions, translocations and ploidy) are superimposed over promoter-specific methylation events that are responsible for gene-specific expression changes observed in breast cancer metastasis.
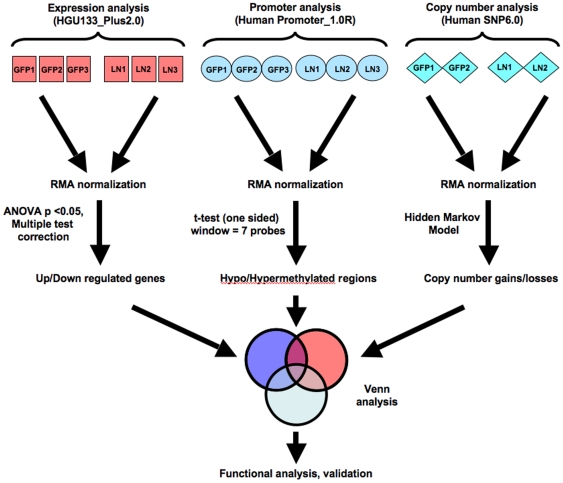
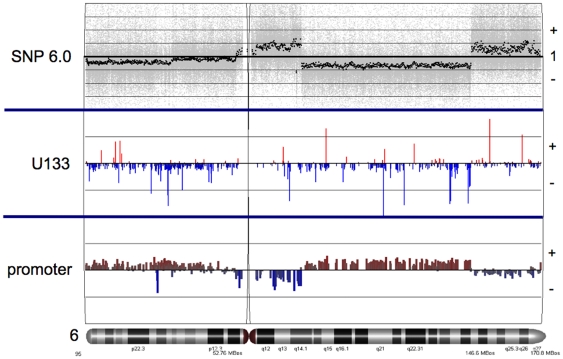
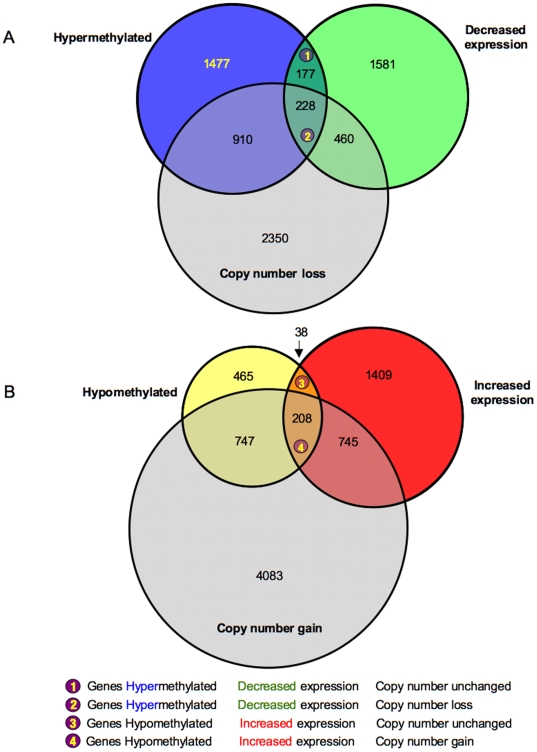
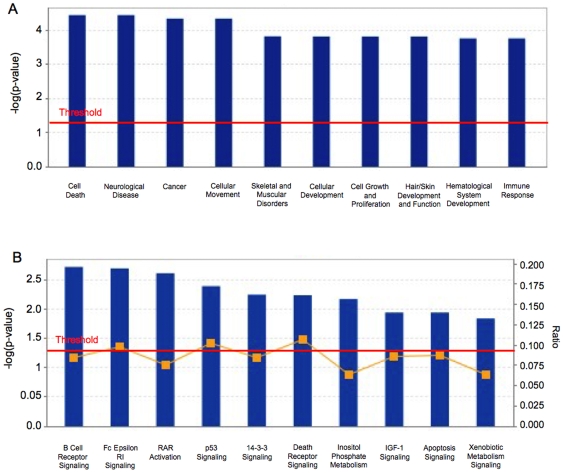
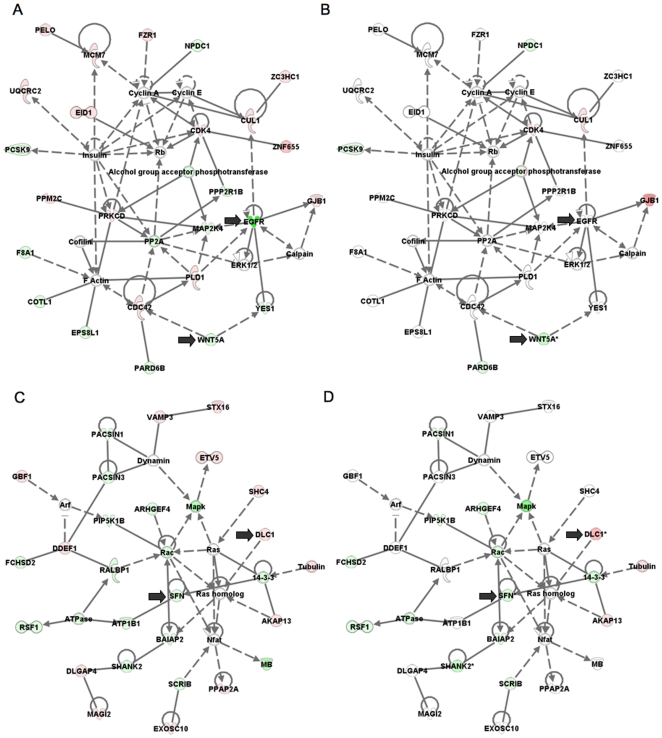
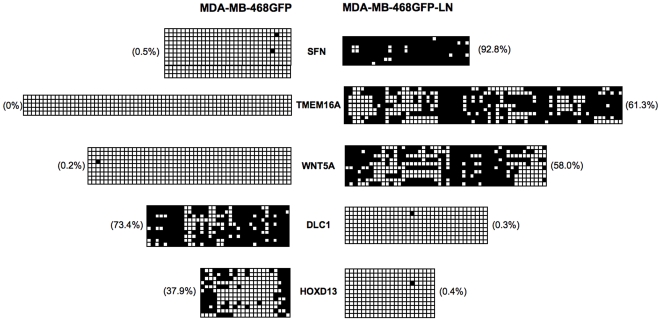
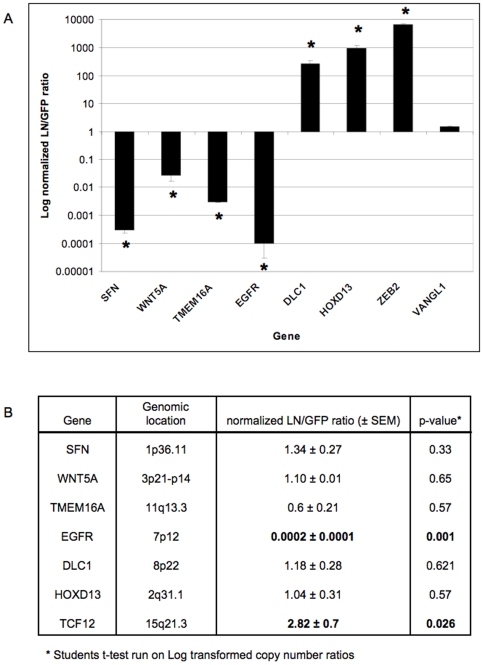
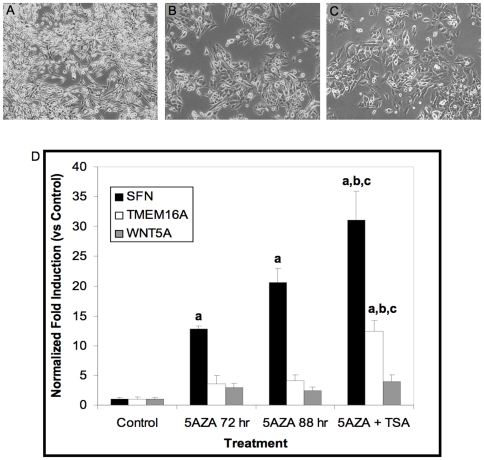
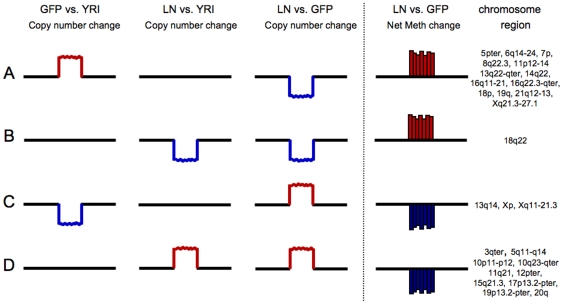
Methodology/principal findings: We undertook simultaneous high-resolution, whole-genome analyses of MDA-MB-468GFP and MDA-MB-468GFP-LN human breast cancer cell lines (an isogenic, paired lymphatic metastasis cell line model) using Affymetrix gene expression (U133), promoter (1.0R), and SNP/CNV (SNP 6.0) microarray platforms to correlate data from gene expression, epigenetic (DNA methylation), and combination copy number variant/single nucleotide polymorphism microarrays. Using Partek Software and Ingenuity Pathway Analysis we integrated datasets from these three platforms and detected multiple hypomethylation and hypermethylation events. Many of these epigenetic alterations correlated with gene expression changes. In addition, gene dosage events correlated with the karyotypic differences observed between the cell lines and were reflected in specific promoter methylation patterns. Gene subsets were identified that correlated hyper (and hypo) methylation with the loss (or gain) of gene expression and in parallel, with gene dosage losses and gains, respectively. Individual gene targets from these subsets were also validated for their methylation, expression and copy number status, and susceptible gene pathways were identified that may indicate how selective advantage drives the processes of tumourigenesis and metastasis.
Conclusions/significance: Our approach allows more precisely profiling of functionally relevant epigenetic signatures that are associated with cancer progression and metastasis.
Conflict of interest statement
Figures
Similar articles
-
Epigenetic mapping and functional analysis in a breast cancer metastasis model using whole-genome promoter tiling microarrays.Breast Cancer Res. 2008;10(4):R62. doi: 10.1186/bcr2121. Epub 2008 Jul 18. Breast Cancer Res. 2008. PMID: 18638373 Free PMC article.
-
Integrative analysis reveals relationships of genetic and epigenetic alterations in osteosarcoma.PLoS One. 2012;7(11):e48262. doi: 10.1371/journal.pone.0048262. Epub 2012 Nov 7. PLoS One. 2012. PMID: 23144859 Free PMC article.
-
An integrated genomics analysis of epigenetic subtypes in human breast tumors links DNA methylation patterns to chromatin states in normal mammary cells.Breast Cancer Res. 2016 Feb 29;18(1):27. doi: 10.1186/s13058-016-0685-5. Breast Cancer Res. 2016. PMID: 26923702 Free PMC article.
-
Epigenetic regulation of breast cancer metastasis.Cancer Metastasis Rev. 2024 Jun;43(2):597-619. doi: 10.1007/s10555-023-10146-7. Epub 2023 Oct 19. Cancer Metastasis Rev. 2024. PMID: 37857941 Review.
-
Integrating the multiple dimensions of genomic and epigenomic landscapes of cancer.Cancer Metastasis Rev. 2010 Mar;29(1):73-93. doi: 10.1007/s10555-010-9199-2. Cancer Metastasis Rev. 2010. PMID: 20108112 Free PMC article. Review.
Cited by
-
Strategies for the discovery and development of therapies for metastatic breast cancer.Nat Rev Drug Discov. 2012 Jun 1;11(6):479-97. doi: 10.1038/nrd2372. Nat Rev Drug Discov. 2012. PMID: 22653217 Review.
-
The Lq- NORM LEARNING FOR ULTRAHIGH-DIMENSIONAL SURVIVAL DATA: AN INTEGRATIVE FRAMEWORK.Stat Sin. 2020 Jul;30(3):1213-1233. doi: 10.5705/ss.202017.0537. Stat Sin. 2020. PMID: 32742137 Free PMC article.
-
Potential Role of Selenoenzymes and Antioxidant Metabolism in relation to Autism Etiology and Pathology.Autism Res Treat. 2014;2014:164938. doi: 10.1155/2014/164938. Epub 2014 Mar 5. Autism Res Treat. 2014. PMID: 24734177 Free PMC article. Review.
-
Genomic deregulation during metastasis of renal cell carcinoma implements a myofibroblast-like program of gene expression.Cancer Res. 2010 Dec 1;70(23):9682-92. doi: 10.1158/0008-5472.CAN-10-2279. Epub 2010 Oct 15. Cancer Res. 2010. PMID: 20952505 Free PMC article.
-
CHST11 gene expression and DNA methylation in breast cancer.Int J Oncol. 2015 Mar;46(3):1243-51. doi: 10.3892/ijo.2015.2828. Epub 2015 Jan 9. Int J Oncol. 2015. PMID: 25586191 Free PMC article.
References
-
- Xu J, Chambers AF, Tuck AB, Rodenhiser DI. Molecular cytogenetic characterization of human breast cancer cell line MDA-MB-468 and its variant 468LN, which displays aggressive lymphatic metastasis. Cancer Genetics and Cytogenetics. 2008;181:1–7. - PubMed
-
- van 't Veer LJ, Dai H, van de Vijver MJ, He YD, Hart AA, et al. Gene expression profiling predicts clinical outcome of breast cancer. Nature. 2002;415:530–536. - PubMed
-
- Sadikovic B, Andrews J, Carter D, Robinson J, Rodenhiser DI. Genome-wide H3K9 histone acetylation profiles are altered in benzopyrene treated MCF7 breast cancer cells. J Biol Chem. 2008;283:4051–4060. - PubMed
-
- Wang Y, Klijn JG, Zhang Y, Sieuwerts AM, Look MP, et al. Gene-expression profiles to predict distant metastasis of lymph-node-negative primary breast cancer. Lancet. 2005;365:671–679. - PubMed
Publication types
MeSH terms
LinkOut - more resources
Full Text Sources
Other Literature Sources
Medical
Molecular Biology Databases
Research Materials
Miscellaneous
