. 2010 Aug;33(4):207-23.
doi: 10.1007/s10753-009-9175-6.

Squamous carcinoma cells influence monocyte phenotype and suppress lipopolysaccharide-induced TNF-alpha in monocytes

Affiliations

Squamous carcinoma cells influence monocyte phenotype and suppress lipopolysaccharide-induced TNF-alpha in monocytes

Aroonwan Lam-ubol et al. Inflammation. 2010 Aug.

Abstract

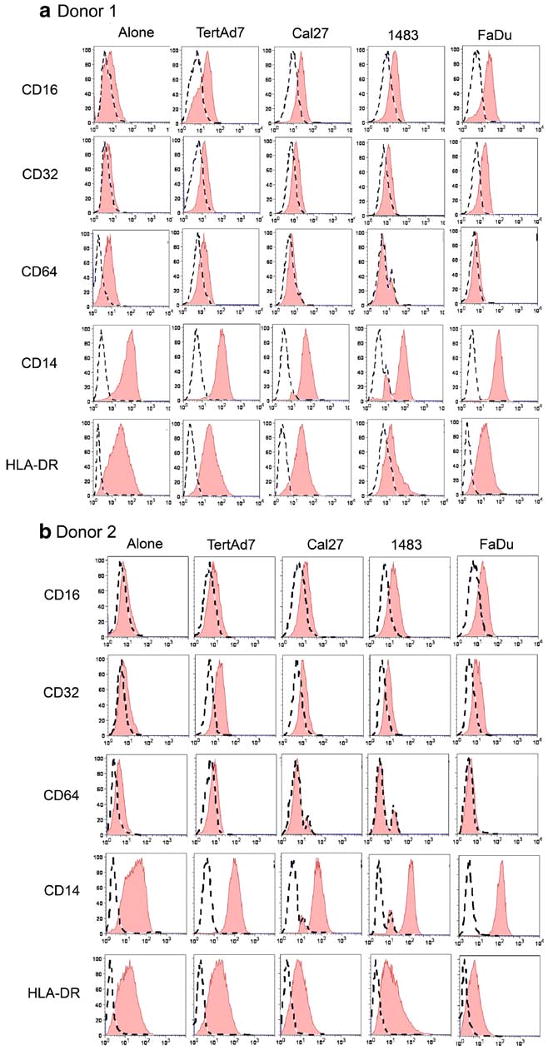
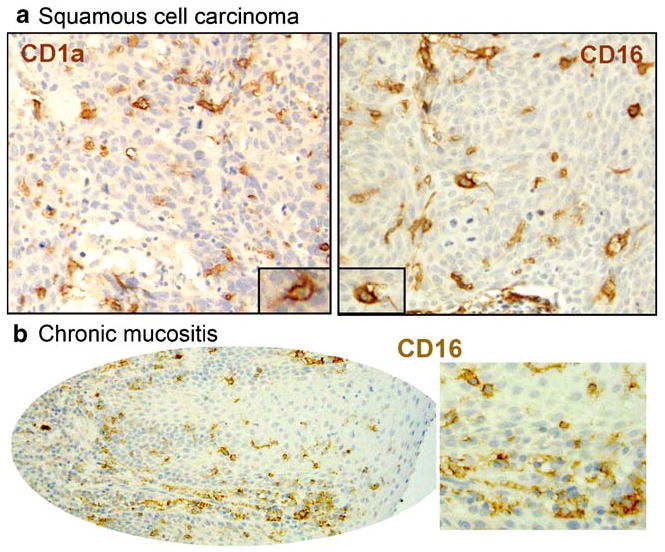
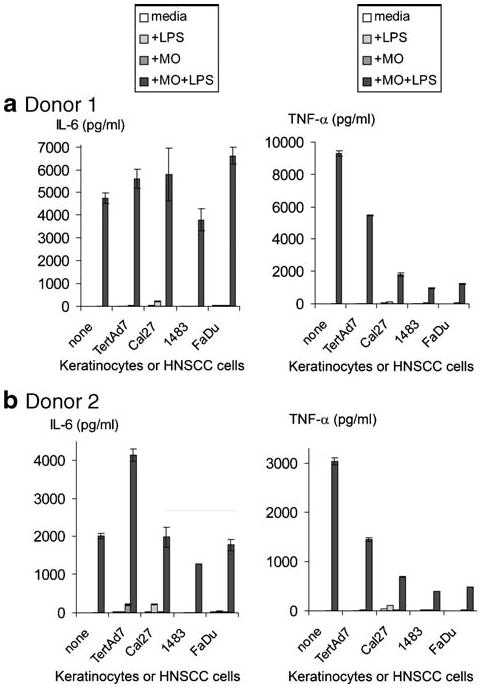
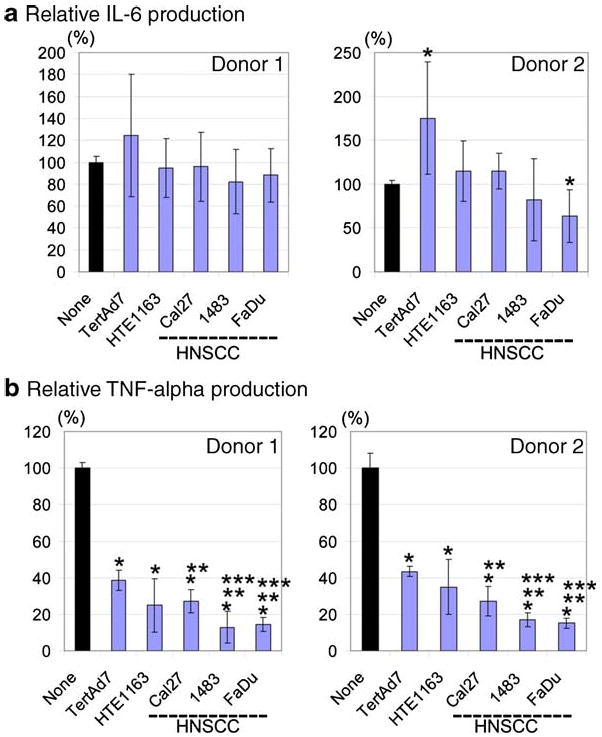
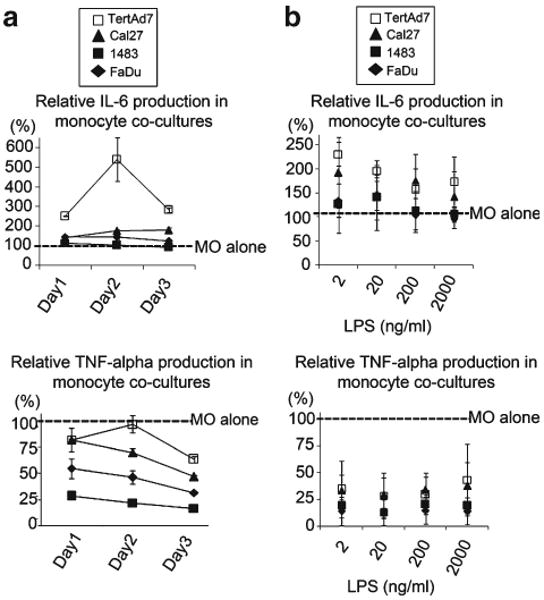
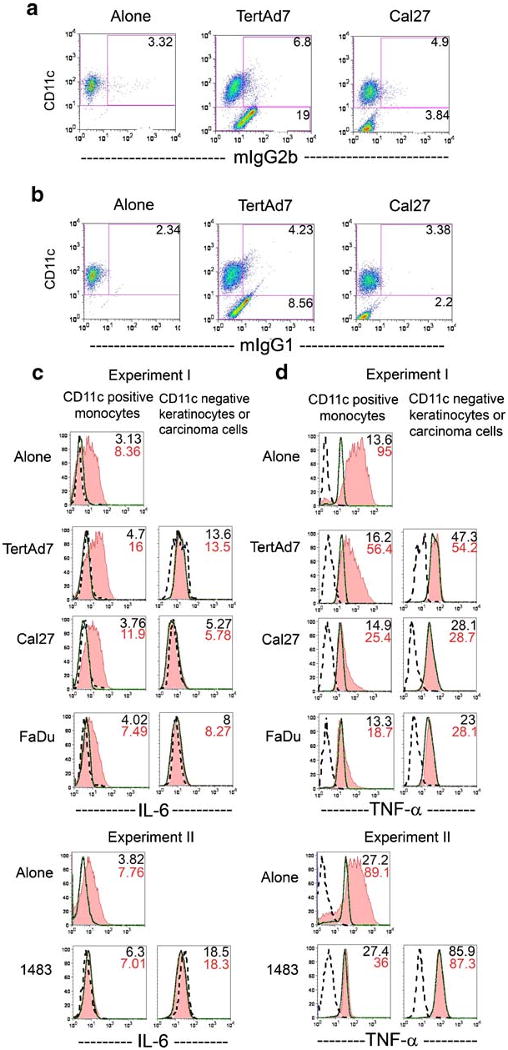
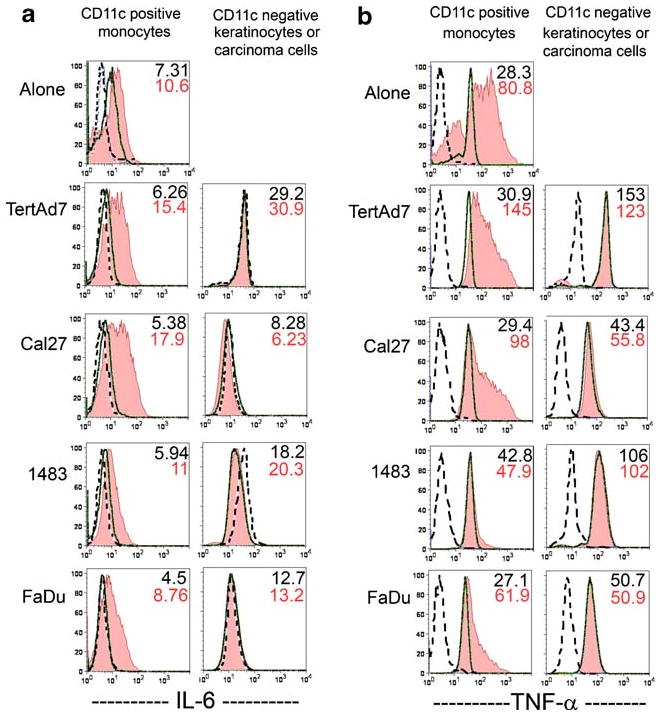
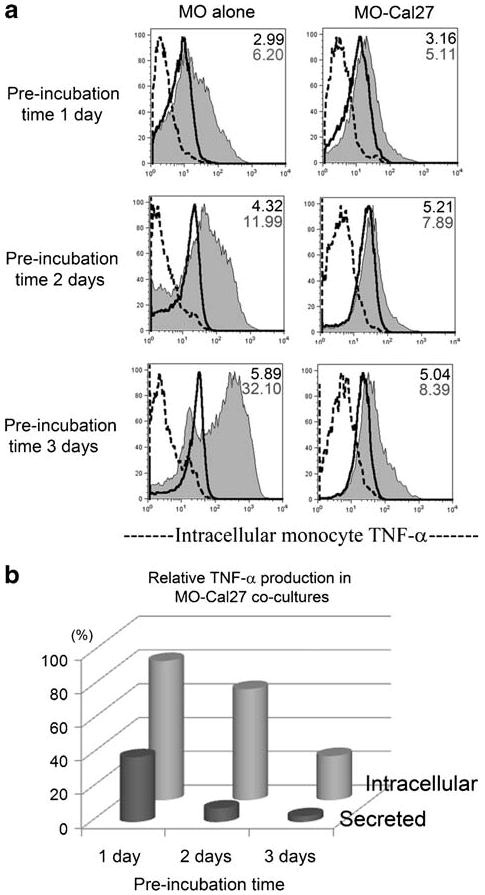
Bacteria and chronic inflammation are present in squamous cell carcinoma of the head and neck (HNSCC), but their roles in the pathogenesis of HNSCC are unclear. Our studies described here revealed that human monocytes co-cultured short term with HNSCC cells were more likely to express CD16, and CD16(+) small mononuclear cells were common in HNSCC specimens. In addition, we identified monocytes as the primary source of LPS-induced IL-6 and TNF-alpha in the monocyte-HNSCC co-cultures. Remarkably, relative to LPS-stimulated monocytes cultured alone, HNSCC cells profoundly suppressed LPS-induced TNF-alpha in monocytes, without compromising IL-6 production. High levels of cytoprotective factors like IL-6 and low levels of TNF-alpha are important for the tumor microenvironment that enables tumor cell survival, affects monocyte differentiation and may contribute to tumor colonization by bacteria. This study provides novel observations that HNSCC cells affect monocyte phenotype and function, which are relevant to the regulation of the HNSCC microenvironment.


Figures

Fig. 1
Fig. 1
HNSCC cells and keratinocytes affect monocyte phenotype in vitro. Monocytes from Donor 1 (a) and Donor 2 (b) were cultured alone or co-cultured with keratinocytes or HNSCC cells for up to 3 days and evaluated by flow cytometry for cell-surface phenotype, as described in the “Materials and Methods”. The results are representative of at least three independent experiments for each donor.
Fig. 2
Fig. 2
Morphology and distribution of CD16+ cells in oral mucosal samples. Sections of archival specimens were stained by immunohistochemistry for CD1a or for CD16. CD1a+ cells (left) and CD16+ cells (right) have brown cell-surface labeling, and the nuclei are counterstained blue. a Oral squamous cell carcinoma (OSCC) samples contain CD16+ cells with dendritic morphology that are similar in morphology and distribution to CD1a+ DC. b Similar to SCC, CD16+ round cells and cells with dendritic morphology are present in inflamed mucosa in the absence of pre-malignant/malignant epithelial change.
Fig. 3
Fig. 3
IL-6 and TNF-alpha production by monocytes, keratinocytes and HNSCC cells in the conditions indicated. Monocytes from Donor 1 (a) and Donor 2 (b), keratinocytes and HNSCC cells were cultured alone or in co-cultures, as indicated, with or without 200 ng/ml LPS for 3 days. Supernatants were stored frozen at −80°C followed by ELISA. “None”—no keratinocytes or HNSCC cells (just monocytes +/− LPS).
Fig. 4
Fig. 4
Relative levels of IL-6 (a) and TNF-alpha (b) in the supernatants of LPS-stimulated monocyte co-cultures with keratinocytes or HNSCC cells as a percent of control LPS-stimulated monocytes cultured alone. For each donor, combined IL-6 ELISA data and TNF-alpha ELISA data, respectively, from 3 to 5 independent experiments were analyzed statistically to determine the levels of cytokine production in LPS-stimulated monocyte co-cultures with keratinocytes or HNSCC cells, relative to control LPS-stimulated monocytes cultured alone (100%). In addition, cytokine levels induced by LPS in the presence of HNSCC cells (Cal27, 1483, FaDu) were evaluated relative to those produced in the presence of keratinocytes (TertAd7 and HTE1163). Statistical analysis was performed using SAS 9.1 GLM procedure for one-way analysis of variance. For multiple comparisons, the two-sided p-value = 0.01 was used. * - Statistically significant difference from the control LPS-stimulated monocytes cultured alone. ** - Statistically significant difference from LPS-monocyte-TertAd7 co-cultures. *** - Statistically significant difference from LPS-monocyte-HTE1163 co-cultures.
Fig. 5
Fig. 5
Relative IL-6 and TNF-alpha production with respect to time course (a) and LPS dose titration (b). a Donor 1 monocytes were cultured alone or co-cultured with keratinocytes (TertAd7) or HNSCC cells, and 200 ng/ml LPS was added on day 0. Culture supernatants were collected and analyzed 1, 2 and 3 days after LPS stimulation. LPS-induced IL-6 and TNF-alpha production, respectively, on each day of monocyte co-cultures is shown as percent of that produced in LPS-stimulated monocytes cultured alone. The results are representative of two independent experiments. b Donor 1 monocytes were cultured alone or co-cultured with keratinocytes (TertAd7) or HNSCC cells and stimulated on day 0 with 2, 20, 200 and 2,000 ng/ml LPS. Culture supernatants were collected 3 days after LPS stimulation. LPS-induced IL-6 and TNF-alpha production in monocyte co-cultures is shown relative to corresponding LPS-stimulated monocytes cultured alone. Results shown are from 3 independent experiments.
Fig. 6
Fig. 6
Intracellular IL-6 and TNF-alpha in Donor 1 monocytes, in keratinocytes and in HNSCC cells. Panels a and b are examples of controls and flow cytometry dot plots. The cells were cultured for 3 days alone or in co-cultures, stimulated with LPS for 6 h in the presence of Brefeldin A, labeled with anti-CD11c-Cy-5-PE antibodies, briefly fixed, permeabilized and stained intracellularly with anti-IL-6-PE (c) or its respective negative control mIgG2b-PE (a and c). Alternatively, intracellular staining was performed with anti-TNF-alpha-PE antibodies (d) or the respective negative control mIgG1-PE (b and d). Panels c and d show overlay histograms for CD11c+ cells (monocytes, left column of histograms) and CD11cneg cells (keratinocytes or HNSCC cells, right column). Dotted line = negative control; solid thick line = cytokine signal without LPS stimulation; shaded histogram = cytokine signal with LPS stimulation. Mean fluorescence intensities (MFI) of the IL-6 and TNF-alpha signals are shown in the upper right corner of each plot, in the absence of LPS (top number) and in the presence of LPS (bottom number). Results are representative of at least 3 independent experiments.
Fig. 7
Fig. 7
Intracellular IL-6 and TNF-alpha in Donor 2 monocytes, in keratinocytes and in HNSCC cells. The experiments were conducted as described in legend to Fig. 6 and flow cytometry analysis was the same as described in Fig. 6. a Intracellular IL-6 in CD11c+ cells (monocytes, left column of histograms) and CD11cneg cells (keratinocytes or HNSCC cells, right column). b Intracellular TNF-alpha in CD11c+ cells (left column) and in keratinocytes or HNSCC cells (right column). Cytokine signal MFI is shown in the upper right corner of each plot: without LPS (top number) and with LPS (bottom number). Results are representative of three independent experiments.
Fig. 8
Fig. 8
Prolonged LPS-free pre-incubation of monocytes with HNSCC Cal27 cells enhanced the suppression of LPS-induced TNF-alpha production. Donor 1 monocytes were cultured alone or co-cultured with Cal27 for 1, 2 or 3 days before stimulating with 200 ng/ml LPS for 6 h in the presence of Brefeldin A, labeled with anti-CD11c-Cy-5-PE antibodies, briefly fixed, permeabilized and stained with anti-TNF-alpha-PE antibodies or negative control. In parallel wells, each LPS stimulation continued for 24 h and supernatants were evaluated for secreted TNF-alpha by ELISA. a Histograms of intracellular TNF-alpha in monocytes: dotted line = negative control; solid thick line = TNF signal without LPS; shaded histogram = TNF signal with LPS stimulation. MFI of the TNF signals are shown in the upper right corner of each plot, in the absence of LPS (top number) and in the presence of LPS (bottom number). b Relative values of intracellular and secreted TNF-alpha in LPS-stimulated MO-Cal27 co-cultures as percent of control LPS-stimulated monocytes cultured alone. The results are representative of three independent experiments.

Similar articles

Cited by

References

    1. Gallo O, Gori AM, Attanasio M, Martini F, Giusti B, Brunelli T, et al. Interleukin-6 and acute-phase proteins in head and neck cancer. European Archives of Oto-Rhino-Laryngology. 1995;252:159–162. - PubMed
    1. Druzgal CH, Chen Z, Yeh NT, Thomas GR, Ondrey FG, Duffey DC, et al. A pilot study of longitudinal serum cytokine and angiogenesis factor levels as markers of therapeutic response and survival in patients with head and neck squamous cell carcinoma. Head and Neck. 2005;27:771–784. - PubMed
    1. Chen Z, Malhotra PS, Thomas GR, Ondrey FG, Duffey DC, Smith CW, et al. Expression of proinflammatory and proangiogenic cytokines in patients with head and neck cancer. Clinical Cancer Research. 1999;5:1369–1379. - PubMed
    1. Sparano A, Lathers DM, Achille N, Petruzzelli GJ, Young MR. Modulation of Th1 and Th2 cytokine profiles and their association with advanced head and neck squamous cell carcinoma. Otolaryngology - Head and Neck Surgery. 2004;131:573–576. - PubMed
    1. Yin W, Cheepala S, Roberts JN, Syson-Chan K, DiGiovanni J, Clifford JL. Active Stat3 is required for survival of human squamous cell carcinoma cells in serum-free conditions. Molecular Cancer. 2006;5:15. - PMC - PubMed

Publication types

MeSH terms