

Income inequality and self-rated health status: evidence from the European Community Household Panel
- PMID: 20084830
- PMCID: PMC2831351
- DOI: 10.1353/dem.0.0071
Income inequality and self-rated health status: evidence from the European Community Household Panel
Abstract
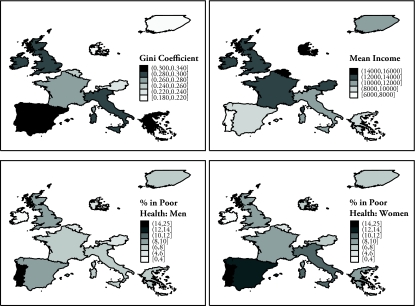
We examine the effect of income inequality on individuals' self-rated health status in a pooled sample of 11 countries, using longitudinal data from the European Community Household Panel survey. Taking advantage of the longitudinal and cross-national nature of our data, and carefully modeling the self-reported health information, we avoid several of the pitfalls suffered by earlier studies on this topic. We calculate income inequality indices measured at two standard levels of geography (NUTS-0 and NUTS-1) and find consistent evidence that income inequality is negatively related to self-rated health status in the European Union for both men and women, particularly when measured at national level. However, despite its statistical significance, the magnitude of the impact of inequality on health is very small.
Figures
References
-
- Atkinson AB, Cantillon B, Marlier E, Nolan B. Social Indicators The EU and Social Inclusion. Oxford, UK: Oxford University Press; 2002.
-
- Blakely TA, Lochner K, Kawachi I. “Metropolitan Area Income Inequality and Selfrated Health—A Multilevel Study”. Social Science & Medicine. 2002;54:65–77. - PubMed
-
- Boes S, Winkelmann R. “Ordered Response Models”. Allgemeines Statistisches Archiv. 2006;90(1):167–81.
-
- Case A, Paxson C. “Sex Differences in Morbidity and Mortality”. Demography. 2005;42:189–214. - PubMed
-
- Clogg CC, Petkova E, Haritou A. “Statistical Methods for Comparing Regression Coefficients Between Models”. American Journal of Sociology. 1995;100:1261–93.
MeSH terms
LinkOut - more resources
Full Text Sources
Medical