

Optimization of a non-radioactive high-throughput assay for decarboxylase enzymes
- PMID: 20085486
- PMCID: PMC3098607
- DOI: 10.1089/adt.2009.0249
Optimization of a non-radioactive high-throughput assay for decarboxylase enzymes
Abstract
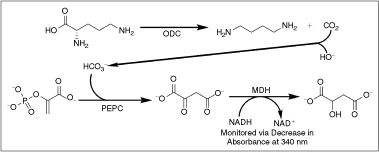
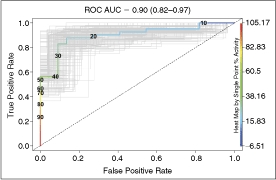
Herein, we describe the optimization of a linked enzyme assay suitable for high-throughput screening of decarboxylases, a target family whose activity has historically been difficult to quantify. Our approach uses a commercially available bicarbonate detection reagent to measure decarboxylase activity. The assay is performed in a fully enclosed automated screening system under inert nitrogen atmosphere to minimize perturbation by exogenous CO2. Receiver operating characteristic (ROC) analysis following a pilot screen of a small library of approximately 3,600 unique molecules for inhibitors of Trypanosoma brucei ornithine decarboxylase quantitatively demonstrates that the assay has excellent discriminatory power (area under the curve = 0.90 with 95% confidence interval between 0.82 and 0.97).
Figures
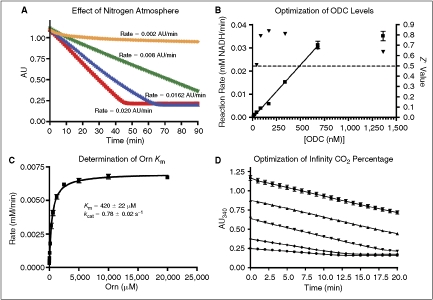
 = reaction rates. Dashed line indicates standard Z′ cutoff value of 0.5. Data were collected in a 384-well microplate using optimized assay conditions with varied final ornithine decarboxylase (ODC) concentrations. Z′ Values were calculated using 8 positive (1 mM difluoromethylornithine (DFMO)) and 8 negative (DMSO) controls. The signal window at 150 nM ODC is ∼5-fold. (C) Determination of ODC Km at 150 nM ODC and 60 μM PLP. Data were collected in a 384-well plate as described and fit to the Michaelis–Menten equation. (D) Optimization of Infinity CO2 percentage ( = 60% Infinity CO2, ▴ = 45% Infinity CO2, ▾ = 30% Infinity CO2, ♦ = 15% Infinity CO2, • = 7.5% Infinity CO2). Data were collected in 384-well plates as described at optimized assay conditions with varied Infinity CO2. Data points were taken every 15 s in quadruplicate. The plot of AU340 vs. time at 60% Infinity CO2 represents a typical data set under optimized assay conditions with a ΔAU340 of ∼0.4 AU.
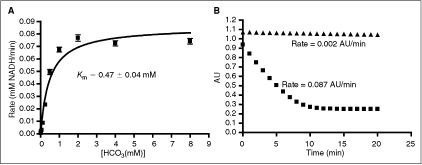 = 0.75 mM HCO3, ▴ = no HCO3). Under optimized assay conditions, the bicarbonate signal was linear for ∼7 min.
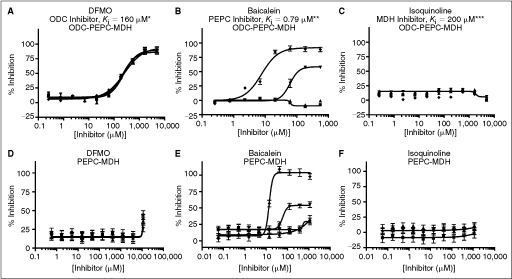 = 60% Infinity CO2, ▴ = 45% Infinity CO2, ▾ = 30% Infinity CO2, ♦ = 15% Infinity CO2). Data were collected under optimized screening conditions as described unless otherwise noted. Compounds were allowed to equilibrate with enzymes for 20 min prior to addition of substrate. Percent inhibition is defined as (1 − vi/vo) × 100. At Infinity, CO2 percentages lower than 45% reaction rates were calculated from the first 10 min of the reaction rather than the normal 20 min used at higher percentages due to limitations in assay linear time (see Fig. 1D). For PEPC-MDH assay results, rates were determined from the first 5 min (see Fig. 2B). (A) Performance of difluoromethylornithine (DFMO), a known ornithine decarboxylase (ODC) inhibitor, in the ODC-PEPC-MDH assay with varying amounts of linking enzymes. Note that linking enzyme concentrations do not effect the performance of DFMO. (B) Performance of baicalein, a known inhibitor of PEPC, at several different final linking mix concentrations in the ODC-PEPC-MDH assay. At normal screening conditions (60% Infinity CO2) no inhibition is seen, even from this submicromolar inhibitor. However, upon dilution of the linking mix, inhibition becomes apparent. (C) Performance of isoquinoline, a known inhibitor of MDH in the ODC-PEPC-MDH assay at several Infinity CO2 percentages. No inhibition was seen in any condition tested. Reaction rates at Infinity CO2 concentrations lower than 45% were calculated from the first 10 min of data due to limitations in assay linear time (see Fig. 1D). (D) Performance of DFMO in the PEPC-MDH assay system at varying levels of Infinity CO2. (E) Performance of baicalein in the PEPC-MDH assay system at varying levels of Infinity CO2. As with the ODC-PEPC-MDH system, a dependency on the amount of linking enzymes present greatly effects the amount of inhibition seen. (F) Performance of isoquinoline in the PEPC-MDH assay. No inhibition was observed under any conditions tested. *Literature value, **Literature value, ***Literature value.
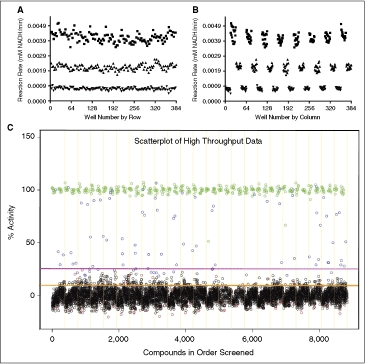 = High signal (DMSO), ▴ = mid signal (200 μM difluoromethylornithine (DFMO)), ▾ = low signal (1 mM DFMO). (A) Column effects resulting in a slight increase in signal on the outer columns. (B) Data from 3A arranged by row, showing that signal across rows is constant. The signal window for the assay is also apparent in these figures and is ∼4.5. (C) Data from the small-scale high-throughput assay of the bioactive compound collection at St. Jude Children’s Research Hospital. Green circles = positive control (1 mM DFMO), red circles = negative control (DMSO), blue circles = hit compound, black circles = inactive compound. Magenta line = 99th percentile cutoff, orange line = 95th percentile cutoff. Percent activity was calculated by normalizing kinetic reaction rates (20-min data collection with the final 6 data points fit as described in Materials and Methods) to positive and negative controls. The 8,832 total data points were collected from ∼3,600 unique compounds. Absolute replicate number for each compound varied from 1 to 7, depending on vendor library composition and plating. The assay took 8.7 h to complete using our automation system.
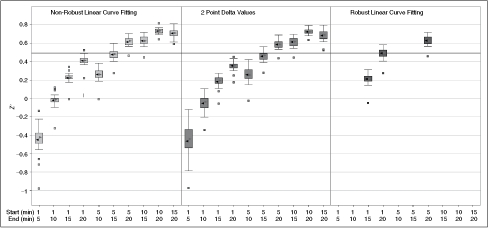
References
-
- Casero RA, Jr, Marton LJ. Targeting polyamine metabolism and function in cancer and other hyperproliferative diseases. Nat Rev Drug Discov. 2007;6:373–390. - PubMed
-
- Heby O, Roberts SC, Ullman B. Polyamine biosynthetic enzymes as drug targets in parasitic protozoa. Biochem Soc Trans. 2003;31:415–419. - PubMed
-
- Bonifati V, Meco G. New, selective catechol-O-methyltransferase inhibitors as therapeutic agents in Parkinson’s disease. Pharmacol Ther. 1999;81:1–36. - PubMed
-
- Ray SS, Bonanno JB, Rajashankar KR, Pinho MG, He G, De Lencastre H et al. Cocrystal structures of diaminopimelate decarboxylase: mechanism, evolution, and inhibition of an antibiotic resistance accessory factor. Structure. 2002;10:1499–1508. - PubMed
Publication types
MeSH terms
Substances
Grants and funding
LinkOut - more resources
Full Text Sources
Other Literature Sources
