. 2010 Jan 19:11:4.
doi: 10.1186/1471-2091-11-4.

Identification of inhibitors of Plasmodium falciparum phosphoethanolamine methyltransferase using an enzyme-coupled transmethylation assay

Affiliations

Identification of inhibitors of Plasmodium falciparum phosphoethanolamine methyltransferase using an enzyme-coupled transmethylation assay

April M Bobenchik et al. BMC Biochem. .

Abstract

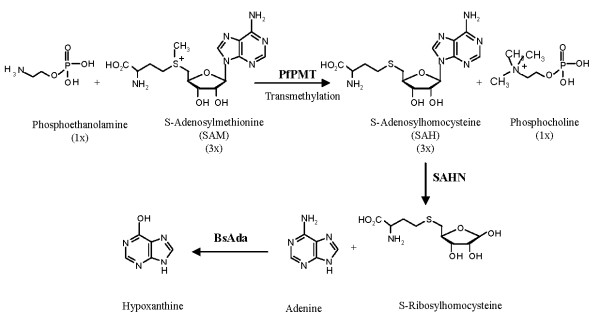
Background: The phosphoethanolamine methyltransferase, PfPMT, of the human malaria parasite Plasmodium falciparum, a member of a newly identified family of phosphoethanolamine methyltransferases (PMT) found solely in some protozoa, nematodes, frogs, and plants, is involved in the synthesis of the major membrane phospholipid, phosphatidylcholine. PMT enzymes catalyze a three-step S-adenosylmethionine-dependent methylation of the nitrogen atom of phosphoethanolamine to form phosphocholine. In P. falciparum, this activity is a limiting step in the pathway of synthesis of phosphatidylcholine from serine and plays an important role in the development, replication and survival of the parasite within human red blood cells.

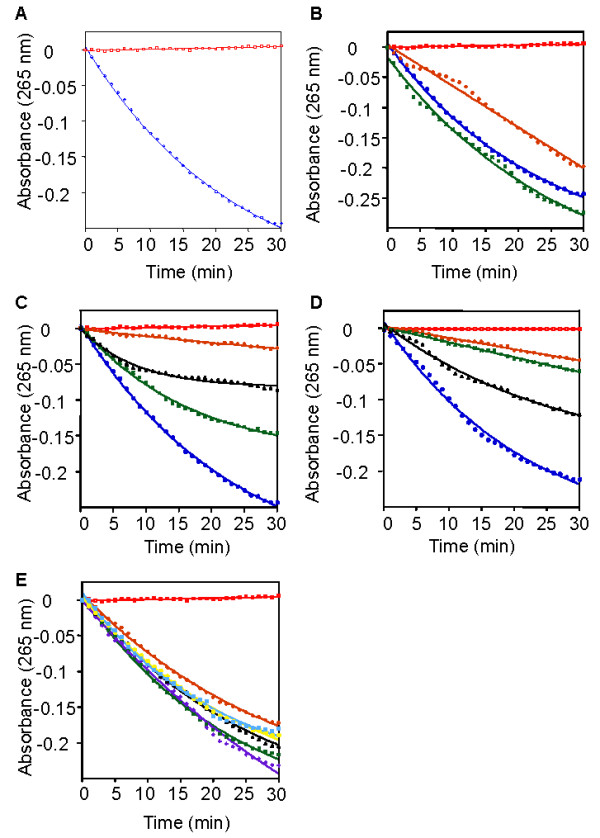
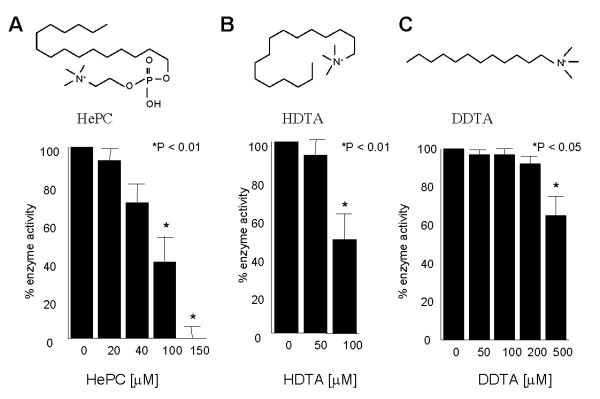
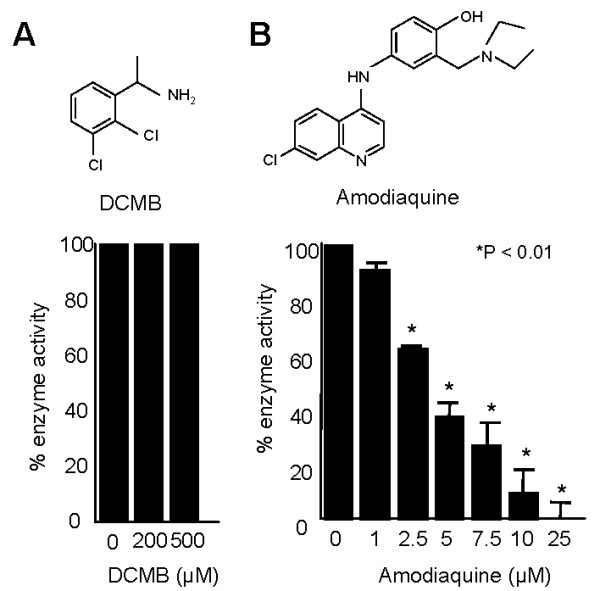
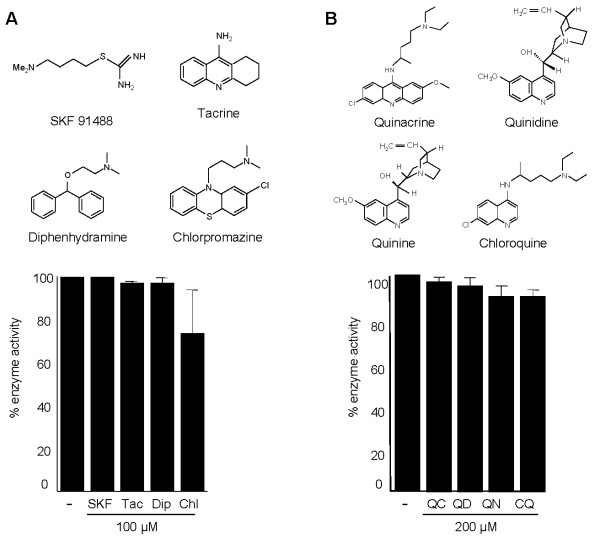
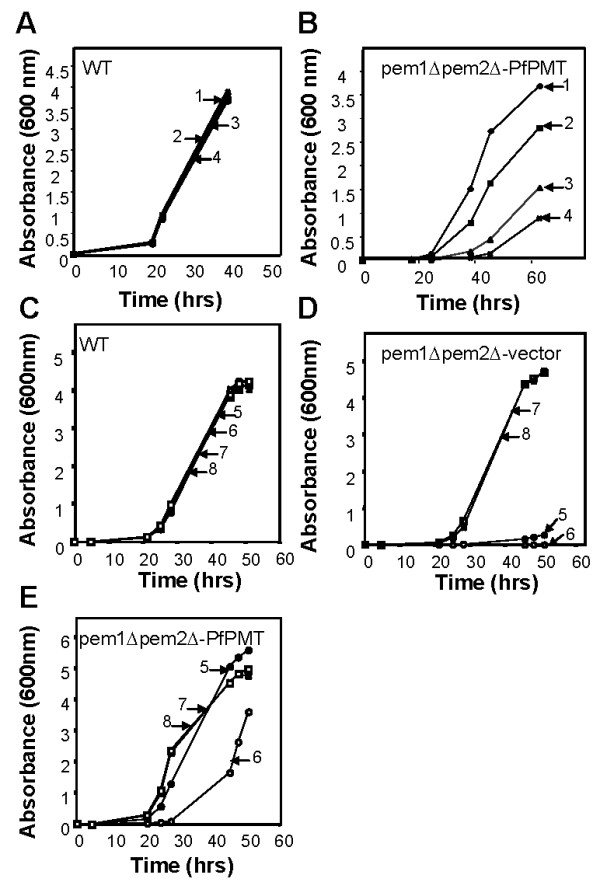
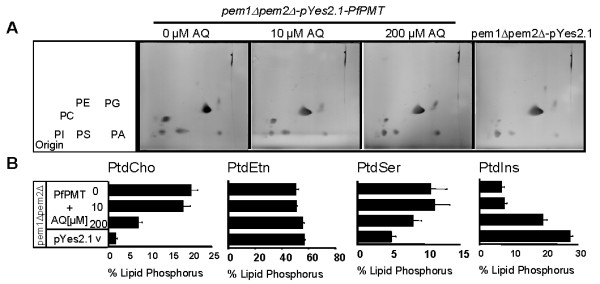
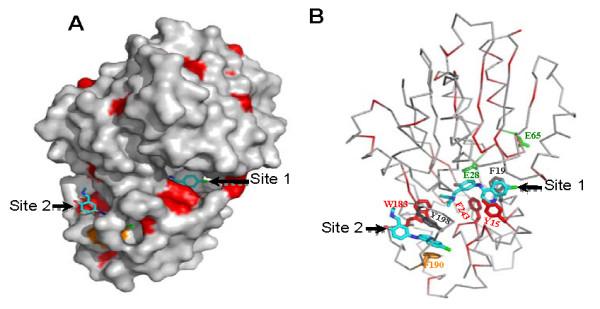
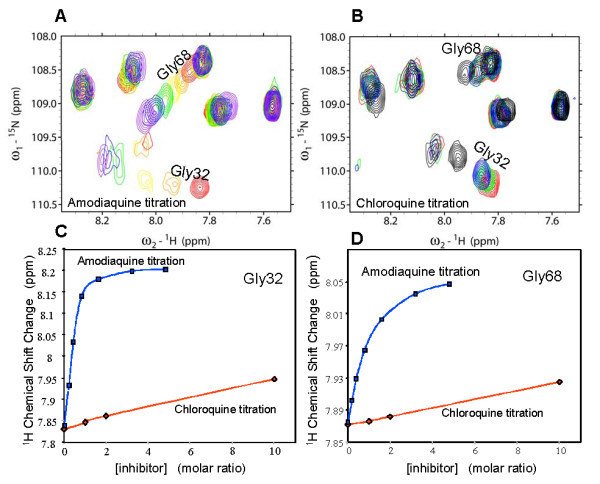
Results: We have employed an enzyme-coupled methylation assay to screen for potential inhibitors of PfPMT. In addition to hexadecyltrimethylammonium, previously known to inhibit PfPMT, two compounds dodecyltrimethylammonium and amodiaquine were also found to inhibit PfPMT activity in vitro. Interestingly, PfPMT activity was not inhibited by the amodiaquine analog, chloroquine, or other aminoquinolines, amino alcohols, or histamine methyltransferase inhibitors. Using yeast as a surrogate system we found that unlike wild-type cells, yeast mutants that rely on PfPMT for survival were sensitive to amodiaquine, and their phosphatidylcholine biosynthesis was inhibited by this compound. Furthermore NMR titration studies to characterize the interaction between amoidaquine and PfPMT demonstrated a specific and concentration dependent binding of the compound to the enzyme.

Conclusion: The identification of amodiaquine as an inhibitor of PfPMT in vitro and in yeast, and the biophysical evidence for the specific interaction of the compound with the enzyme will set the stage for the development of analogs of this drug that specifically inhibit this enzyme and possibly other PMTs.


Figures

Figure 1
Figure 1
Schematic description of the enzyme-coupled assay for measuring PfPMT activity. PfPMT catalyzes the conversion of 1 molecule of P-EA and 3 molecules of SAM to form 1 molecule of phosphocholine and 3 molecules of SAH. SAH is hydrolyzed to adenine and S-ribosylhomocysteine via SAHN nucleosidase. The deamination of adenine into hypoxanthine by adenine deaminase is associated with a decrease in absorbance at 265 nm that can be monitored continuously using UV plate reader.
Figure 2
Figure 2
Spectrophotometric analysis of phosphoethanolamine methyltransferase activity. (A) PfPMT-catalyzed methylation of P-EA. Reaction mixtures contained 200 μM SAM, 200 μM P-EA, 1000 μM MnSO4, 0.5 μM BsAda, 4.72 μM SAHN and 0 μM (red) or 2.5 μM (blue) of purified PfPMT enzyme in 100 mM HEPES assay buffer pH 7.5. The decrease in absorbance was monitored at 265 nm. The reactions components were kept the same as stated above in panels B-E, except when noted. (B) Dependence of the rate of PfPMT-catalyzed reaction on different concentrations of the coupling enzymes. Reactions contained BsAda 0.25 μM and SAHN 2.13 μM (orange), 0.5 μM BsAda, 4.72 μM SAHN (blue) and without PfPMT (red), and BsAda 1 μM and SAHN 8.5 μM (green). (C) Dependence of the rate of PfPMT-catalyzed reaction on different concentrations of SAM and P-EA. Reactions contained P-EA 50 μM and SAM 150 μM (orange), P-EA 100 μM and SAM 100 μM (black), p-Etn 150 μM and SAM 150 μM (green), P-EA 200 μM and SAM 200 μM (blue), and without PfPMT (red). (D) Effect of PfPMT concentration on its activity. Reactions contained 0 μM PfPMT (red), 312.5 nM PfPMT (orange), 625 nM PfPMT (green), 1.25 μM PfPMT (black), and 2.5 μM (blue). (E) Effect of the pH and buffer composition on PfPMT activity. Reaction mixtures contained 200 μM SAM, 200 μM P-EA, 1000 μM MnSO4, 0.5 μM BsAda, 4.72 μM SAHN and 0 μM (red) or 2.5 μM (black), of purified PfPMT enzyme in 100 mM HEPES assay buffer pH 7.5. Reactions also contained 100 mM HEPES assay buffer pH 7 (green), and pH 8 (cyan), as well as 100 mM Tris-HCl assay buffer pH 7 (orange), pH 7.5 (purple), and pH 8 (yellow). Results are representative of three independent experiments.
Figure 3
Figure 3
Inhibition of PfPMT by quaternary amines. Effect of increasing concentrations of hexadecylphosphocholine (HePC) (A), hexadecyltrimethylammonium bromide (HDTA) (B) and dodecyltrimethylammonium bromide (DDTA) on PfPMT activity. The assay was performed as described in Experimental Procedures. The data are the means +/- S.D. for three independent experiments. Statistically significant data with a P < 0.05 is indicated with an asterisk.
Figure 4
Figure 4
Amodiaquine inhibits purified PfPMT activity. Effect of increasing concentrations of DCMB (A) and amodiaquine (AQ) (B) on PfPMT activity. The assay was performed as described in Methods. The data are the means +/- S.D. for three independent experiments. Statistically significant data with a P < 0.01 is indicated with an asterisk.
Figure 5
Figure 5
Effect of HNMT inhibitors and antimalarial aminoquinolines and amino alcohols on PfPMT activity. (A) Effect of the HNMT inhibitors SKF91488 (SKF), tacrine (Tac), diphenhydramine (Dip) and chlorpromazine (Chl) on PfPMT activity. (B) Effect of chloroquine (CQ), quinacrine (QC), quinidine (QD) and quinine (QN) on PfPMT activity. The data are the means +/- S.D. for three independent experiments.
Figure 6
Figure 6
Amodiaquine inhibits PfPMT function in yeast. Growth curves of wild-type (BY4741-pYes2.1) (A) and pem1Δpem2Δ-PfPMT (B) strains grown in minimal medium containing 4% galactose and 100 μM ethanolamine in the presence of 0 μM (1), 10 μM (2), 50 μM (3), or 100 μM (4) AQ. (C-E) Growth curves of wild-type (BY4741-pYes2.1) (C), pem1Δpem2Δ-pYes2.1 (D) and pem1Δpem2Δ-PfPMT (E) yeast strains grown in minimal medium containing 4% galactose and 2 mM ethanolamine in the presence of 0 μM AQ (5), 200 μM AQ (6), 200 μM AQ and 1 mM choline (7), or 1 mM choline (8).
Figure 7
Figure 7
Amodiaquine reduced PfPMT-dependent PtdCho levels in yeast. (A) Phospholipid analysis of pem1Δpem2Δ-pYes2.1 and pem1Δpem2Δ-PfPMT strains grown in minimal medium containing 4% galactose and 2 mM ethanolamine. The lipids were extracted, separated by 2-D TLC and stained with iodine vapor. (B) Each lipid was recovered from the TLC plate and quantified by measuring phosphorous. The graph is the percentage of total lipid phosphorous in each lipid fraction. PtdCho-phosphatidylcholine; PtdEtn- phosphatidylethanolamine; PtdSer- phosphatidylserine; PtdIns- phosphatidylinositol. The data are represented as the means +/- S.D. of three independent experiments.
Figure 8
Figure 8
Prediction of amodiaquine-interacting residues on PfPMT using HNMT structure. (A) Molecular surface representation of HNMT. Red solvent-accessible surfaces identify invariant residues between HNMT and PfPMT. Phe190 is colored in orange. Two AQ molecules are shown as stick with the carbon atoms depicted in cyan, nitrogen in blue, oxygen in red, and chlorine in green. (B) The Cα trace of HNMT in a similar orientation as (A). The AQ-interacting residues are shown as stick forms. The HNMT residues, corresponding to the nine residues of PfPMT whose chemical shifts are perturbed in response to AQ binding, are shown in green. Figures were prepared by using Pymol [56].
Figure 9
Figure 9
NMR analysis of PfPMT-amodiaquine interaction. The glycine region of the 1H-15N HSQC spectra of PfPMT (0.3 mM), titrated with AQ (A) or CQ (B). The different colors indicate the inhibitor concentrations as follows: red- no inhibitor, orange- 1:4, yellow- 1:2, green- 1:1, blue- 2:1, violet- 3:1, black- 10:1. (C and D) Inhibitor titration plots for Gly32 and Gly68 (derived from A and B) showing the difference in binding between AQ and CQ. The overlay of the full HSQC spectrum in the absence or presence of AQ is shown in Additional File 1, Fig. S1.

Similar articles

Cited by

References

    1. WHO. World Malaria Report 2008. Geneva: World Health Organisation; 2008.
    1. Pessi G, Ben Mamoun C. Pathways for phosphatidylcholine biosynthesis: targets and strategies for antimalarial drugs. Future Medicine, Future Lipidology. 2006;1(2):173–180. doi: 10.2217/17460875.1.2.173. - DOI
    1. Pessi G, Kociubinski G, Mamoun CB. A pathway for phosphatidylcholine biosynthesis in Plasmodium falciparum involving phosphoethanolamine methylation. Proc Natl Acad Sci USA. 2004;101:6206–6211. doi: 10.1073/pnas.0307742101. - DOI - PMC - PubMed
    1. Vial HJ, Ben Mamoun C, Sherman IW. Molecular Approaches to Malaria. Washington D.C.: ASM Press; 2005. Plasmodium lipids: Metabolism and Function; pp. 327–352.
    1. Pessi G, Choi JY, Reynolds JM, Voelker DR, Mamoun CB. In vivo evidence for the specificity of Plasmodium falciparum phosphoethanolamine methyltransferase and its coupling to the Kennedy pathway. J Biol Chem. 2005;280(13):12461–12466. doi: 10.1074/jbc.M414626200. - DOI - PubMed

Publication types

MeSH terms

LinkOut - more resources