. 2010 Jan;86(1):23-33.
doi: 10.1016/j.ajhg.2009.11.016.

Leveraging genetic variability across populations for the identification of causal variants

Affiliations

Leveraging genetic variability across populations for the identification of causal variants

Noah Zaitlen et al. Am J Hum Genet. 2010 Jan.

Abstract

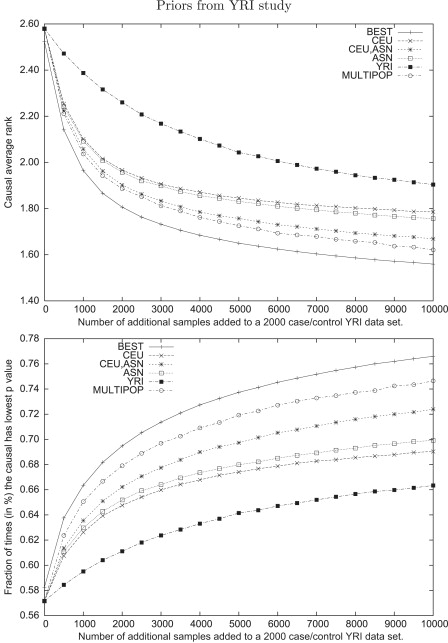
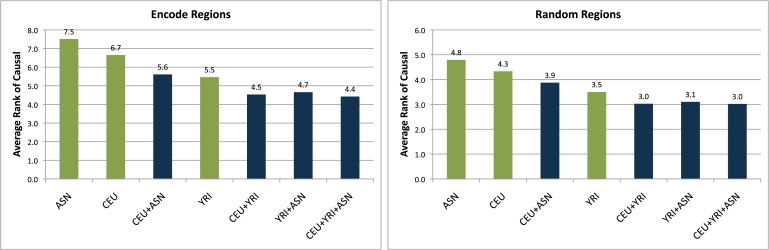
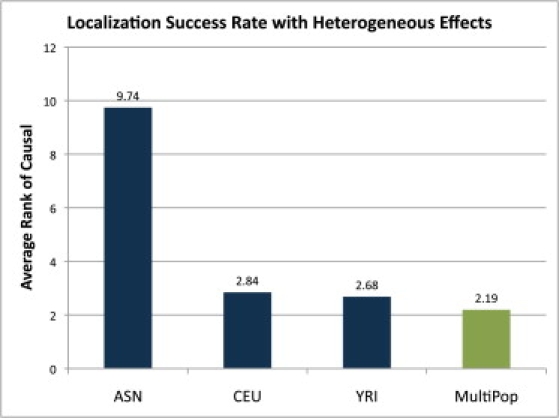
Genome-wide association studies have been performed extensively in the last few years, resulting in many new discoveries of genomic regions that are associated with complex traits. It is often the case that a SNP found to be associated with the condition is not the causal SNP, but a proxy to it as a result of linkage disequilibrium. For the identification of the actual causal SNP, fine-mapping follow-up is performed, either with the use of dense genotyping or by sequencing of the region. In either case, if the causal SNP is in high linkage disequilibrium with other SNPs, the fine-mapping procedure will require a very large sample size for the identification of the causal SNP. Here, we show that by leveraging genetic variability across populations, we significantly increase the localization success rate (LSR) for a causal SNP in a follow-up study that involves multiple populations as compared to a study that involves only one population. Thus, the average power for detection of the causal variant will be higher in a joint analysis than that in studies in which only one population is analyzed at a time. On the basis of this observation, we developed a framework to efficiently search for a follow-up study design: our framework searches for the best combination of populations from a pool of available populations to maximize the LSR for detection of a causal variant. This framework and its accompanying software can be used to considerably enhance the power of fine-mapping studies.


Figures

Figure 1
Figure 1
The Average Rank of the Causal Variant in 10,000 Simulated Loci, with 3000 Cases, 3000 Controls, and γ = 1.4 for Seven Different Study Designs Designs over multiple populations, such as the CEU+YRI, split individuals evenly among them. Using multiple populations reduces the number of functional assays expected before the causal variant is identified.
Figure 2
Figure 2
The Fraction of Times that a Design Achieves the Maximal LSR for Each of the Study Designs The statistics are based on 10,000 simulated loci, with 3000 cases, 3000 controls, and γ = 1.4. As expected, the YRI population is most often the best choice for study design. However, it is the top choice only 44% of the time. The combination of all three populations is almost never the best study design, accounting for only 2.6% of the 10,000 designs. Interestingly, it maximizes the average LSR, suggesting, first, that it protects against the variance of different local LD structures and, second, that tailoring study designs to the loci in the follow-up study is beneficial.
Figure 3
Figure 3
Histogram of the Average Rank of the Causal Variant in 10,000 Simulated Loci, with 1000 Cases, 1000 Controls, and a Relative Risk of 1.4 for Three Different Study Designs over a Range of Relative Risks The study designs are all CEU, all ASN, and CEU+ASN. CEU+ASN designs have individuals split evenly between them. The trend observed in the simple designs is preserved across relative risks.
Figure 4
Figure 4
Average Rank and Fraction of Time that a Causal Variant Has the Best Statistics in Follow-Up Studies over 10,000 Simulated Loci with a Relative Risk of 1.4 The designs include 1000 cases and 1000 controls from the CEU data set combined with x cases and controls taken from CEU, YRI, ASN, and ASN + YRI, where x ranges from 0 to 10,000 in steps of 500. For the studies involving YRI+ASN designs, the same number of samples is taken from both YRI and ASN. The hypothetical optimal method is choosing the optimal design in each of the 10,000 designs, and MULTIPOP uses the populations predicted by our algorithm (see Material and Methods) as having the maximal LSR.
Figure 5
Figure 5
Average Rank and Fraction of Time that a Causal Variant Has the Best Statistics in Follow-Up Studies over 10,000 Simulated Loci with a Relative Risk of 1.4 The designs include 1000 cases and 1000 controls from the YRI data set combined with x cases and controls taken from CEU, YRI, ASN, and ASN + CEU, where x ranges from 0 to 10,000 in steps of 500. For the studies involving CEU+ASN designs, the same number of samples is taken from CEU and ASN. The hypothetical optimal method is choosing the optimal design in each of the 10,000 regions, and MULTIPOP uses the populations predicted by our algorithm (see Material and Methods) as having the maximal LSR.
Figure 6
Figure 6
Histogram of the Average Rank of the Causal Variant in 1000 ENCODE Regions and 1000 HapMap Regions for a Study Size of 1000 Cases and 1000 Controls and a Relative Risk of 1.4 Seven designs over different combinations of the HapMap populations were examined. In both random and ENCODE regions, the use of multiple populations improved the LSR of identifying the causal variant.
Figure 7
Figure 7
Average Rank of the Causal Variant in 10,000 Simulated Loci with 3000 Cases, 3000 Controls, and Relative Risks of 1.1, 1.3, and 1.6 for ASN, YRI, and CEU, Respectively Four study designs were considered: all ASN, all CEU, all YRI, and a multistage design using our MULTIPOP algorithm and designed to address the issue of heterogeneous effects in different populations. Despite an initial stage requiring genotyping of 1000 ASN individuals, our algorithm still outperformed single-population designs.

Similar articles

Cited by

References

    1. Udler M.S., Meyer K.B., Pooley K.A., Karlins E., Struewing J.P., Zhang J., Doody D.R., MacArthur S., Tyrer J., Pharoah P.D., SEARCH Collaborators FGFR2 variants and breast cancer risk: fine-scale mapping using African American studies and analysis of chromatin conformation. Hum. Mol. Genet. 2009;18:1692–1703. - PMC - PubMed
    1. Easton D.F., Pooley K.A., Dunning A.M., Pharoah P.D.P., Thompson D., Ballinger D.G., Struewing J.P., Morrison J., Field H., Luben R., SEARCH collaborators. kConFab. AOCS Management Group Genome-wide association study identifies novel breast cancer susceptibility loci. Nature. 2007;447:1087–1093. - PMC - PubMed
    1. Ioannidis J.P.A., Ntzani E.E., Trikalinos T.A. ‘Racial’ differences in genetic effects for complex diseases. Nat. Genet. 2004;36:1312–1318. - PubMed
    1. Frazer K.A., Ballinger D.G., Cox D.R., Hinds D.A., Stuve L.L., Gibbs R.A., Belmont J.W., Boudreau A., Hardenbol P., Leal S.M., International HapMap Consortium A second generation human haplotype map of over 3.1 million SNPs. Nature. 2007;449:851–861. - PMC - PubMed
    1. Han B., Kang H.M., Eskin E. Rapid and accurate multiple testing correction and power estimation for millions of correlated markers. PLoS Genet. 2009;5:e1000456. - PMC - PubMed

Publication types

LinkOut - more resources