ODE models for oncolytic virus dynamics
- PMID: 20085772
- PMCID: PMC2839021
- DOI: 10.1016/j.jtbi.2010.01.009
ODE models for oncolytic virus dynamics
Abstract
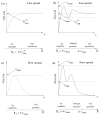
Replicating oncolytic viruses are able to infect and lyse cancer cells and spread through the tumor, while leaving normal cells largely unharmed. This makes them potentially useful in cancer therapy, and a variety of viruses have shown promising results in clinical trials. Nevertheless, consistent success remains elusive and the correlates of success have been the subject of investigation, both from an experimental and a mathematical point of view. Mathematical modeling of oncolytic virus therapy is often limited by the fact that the predicted dynamics depend strongly on particular mathematical terms in the model, the nature of which remains uncertain. We aim to address this issue in the context of ODE modeling, by formulating a general computational framework that is independent of particular mathematical expressions. By analyzing this framework, we find some new insights into the conditions for successful virus therapy. We find that depending on our assumptions about the virus spread, there can be two distinct types of dynamics. In models of the first type (the "fast spread" models), we predict that the viruses can eliminate the tumor if the viral replication rate is sufficiently high. The second type of models is characterized by a suboptimal spread (the "slow spread" models). For such models, the simulated treatment may fail, even for very high viral replication rates. Our methodology can be used to study the dynamics of many biological systems, and thus has implications beyond the study of virus therapy of cancers.
(c) 2010 Elsevier Ltd. All rights reserved.
Figures


Similar articles
-
Towards predictive computational models of oncolytic virus therapy: basis for experimental validation and model selection.PLoS One. 2009;4(1):e4271. doi: 10.1371/journal.pone.0004271. Epub 2009 Jan 30. PLoS One. 2009. PMID: 19180240 Free PMC article.
-
Computational modeling approaches to studying the dynamics of oncolytic viruses.Math Biosci Eng. 2013 Jun;10(3):939-57. doi: 10.3934/mbe.2013.10.939. Math Biosci Eng. 2013. PMID: 23906157 Review.
-
Complex spatial dynamics of oncolytic viruses in vitro: mathematical and experimental approaches.PLoS Comput Biol. 2012;8(6):e1002547. doi: 10.1371/journal.pcbi.1002547. Epub 2012 Jun 14. PLoS Comput Biol. 2012. PMID: 22719239 Free PMC article.
-
A mathematical model of oncolytic virotherapy with time delay.Math Biosci Eng. 2019 Mar 6;16(4):1836-1860. doi: 10.3934/mbe.2019089. Math Biosci Eng. 2019. PMID: 31137188
-
Quantitative imaging and dynamics of tumor therapy with viruses.FEBS J. 2021 Nov;288(21):6273-6285. doi: 10.1111/febs.16102. Epub 2021 Aug 29. FEBS J. 2021. PMID: 34213827 Review.
Cited by
-
The Role of the Innate Immune System in Oncolytic Virotherapy.Comput Math Methods Med. 2017;2017:6587258. doi: 10.1155/2017/6587258. Epub 2017 Dec 12. Comput Math Methods Med. 2017. PMID: 29379572 Free PMC article.
-
A dynamical systems model for combinatorial cancer therapy enhances oncolytic adenovirus efficacy by MEK-inhibition.PLoS Comput Biol. 2011 Feb;7(2):e1001085. doi: 10.1371/journal.pcbi.1001085. Epub 2011 Feb 17. PLoS Comput Biol. 2011. PMID: 21379332 Free PMC article.
-
Modeling Oncolytic Viral Therapy, Immune Checkpoint Inhibition, and the Complex Dynamics of Innate and Adaptive Immunity in Glioblastoma Treatment.Front Physiol. 2020 Mar 3;11:151. doi: 10.3389/fphys.2020.00151. eCollection 2020. Front Physiol. 2020. PMID: 32194436 Free PMC article.
-
Perfusion Pressure Is a Critical Determinant of the Intratumoral Extravasation of Oncolytic Viruses.Mol Ther. 2016 Feb;24(2):306-317. doi: 10.1038/mt.2015.219. Epub 2015 Dec 9. Mol Ther. 2016. PMID: 26647825 Free PMC article.
-
Mathematical modeling of viral infection dynamics in spherical organs.J Math Biol. 2013 Dec;67(6-7):1425-55. doi: 10.1007/s00285-012-0593-y. Epub 2012 Sep 25. J Math Biol. 2013. PMID: 23007600
References
-
- Adam JA, Bellomo N. A survey of models for tumor-immune system dynamics. Boston: Birkhauser; 1997.
-
- Aghi M, Martuza RL. Oncolytic viral therapies - the clinical experience. Oncogene. 2005;24:7802–16. - PubMed
-
- Anderson RM, May RM. Infectious diseases of humans. Oxford, England: Oxford University Press; 1991.
-
- Bajzer Z, Carr T, Josic K, Russell SJ, Dingli D. Modeling of cancer virotherapy with recombinant measles viruses. J Theor Biol. 2008;252:109–22. - PubMed
-
- Bell JC. Oncolytic viruses: what's next? Curr Cancer Drug Targets. 2007;7:127–31. - PubMed
Publication types
MeSH terms
Grants and funding
LinkOut - more resources
Full Text Sources

