. 2010 Apr 2;208(2):636-42.
doi: 10.1016/j.bbr.2010.01.011. Epub 2010 Jan 18.

Altered glutamatergic neurotransmission in the striatum regulates ethanol sensitivity and intake in mice lacking ENT1

Affiliations

Altered glutamatergic neurotransmission in the striatum regulates ethanol sensitivity and intake in mice lacking ENT1

Jihuan Chen et al. Behav Brain Res. .

Abstract

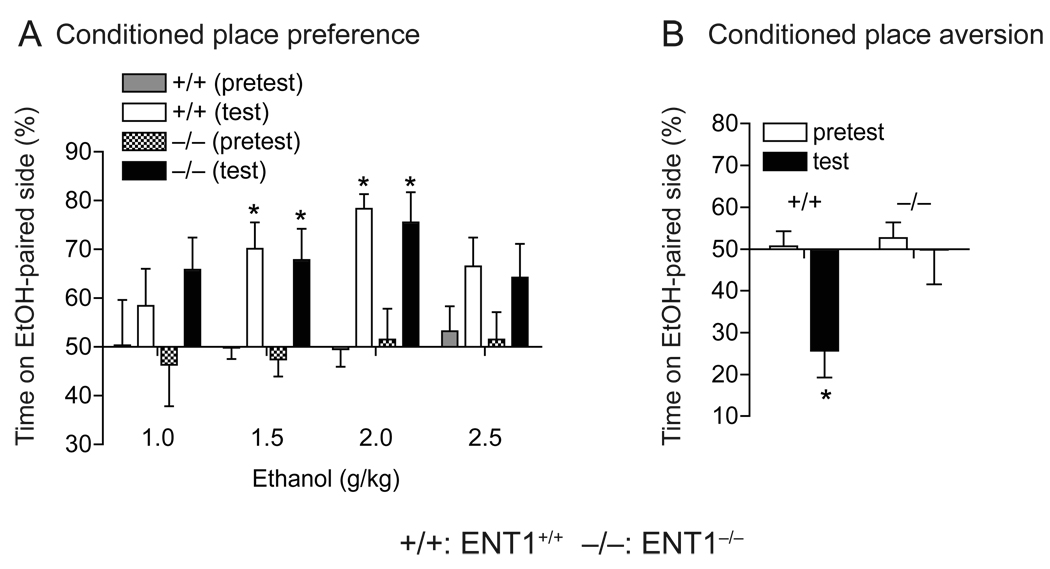
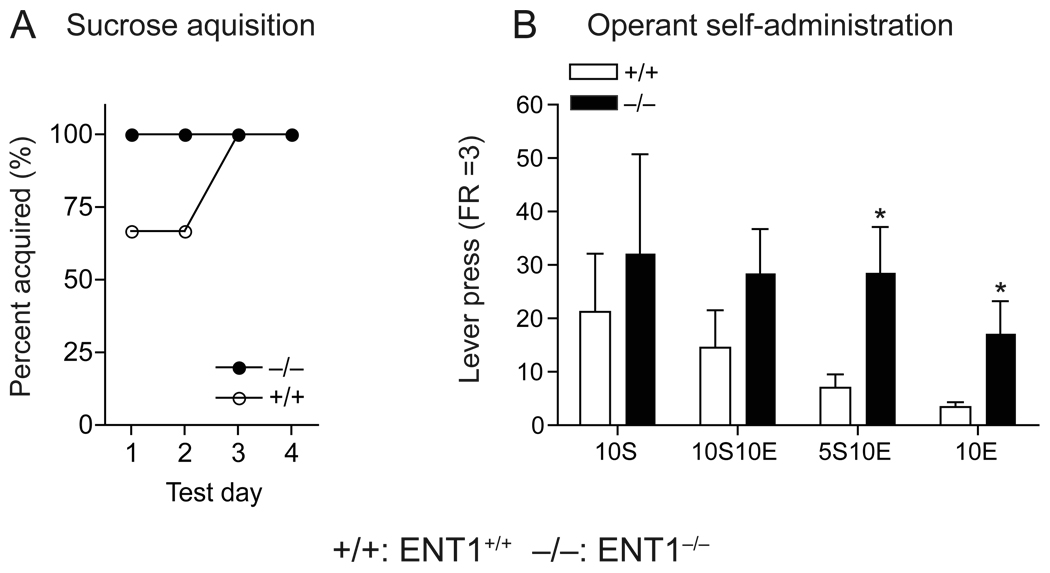
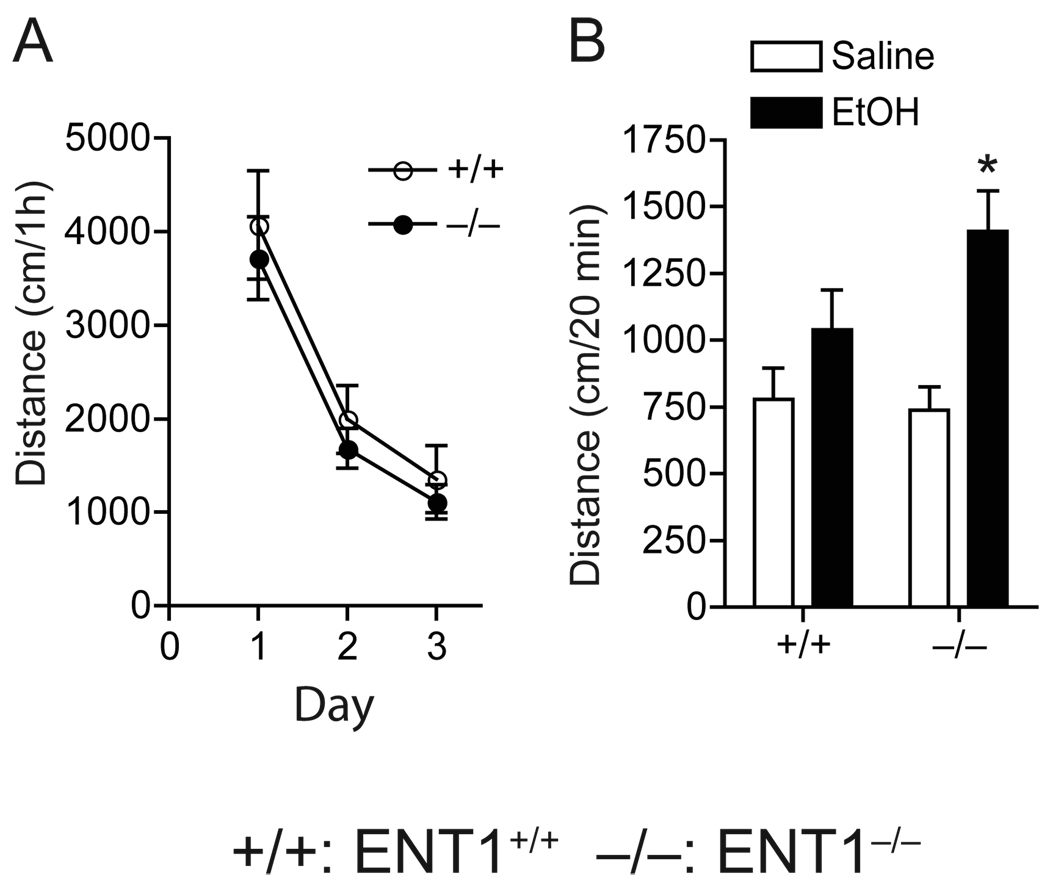
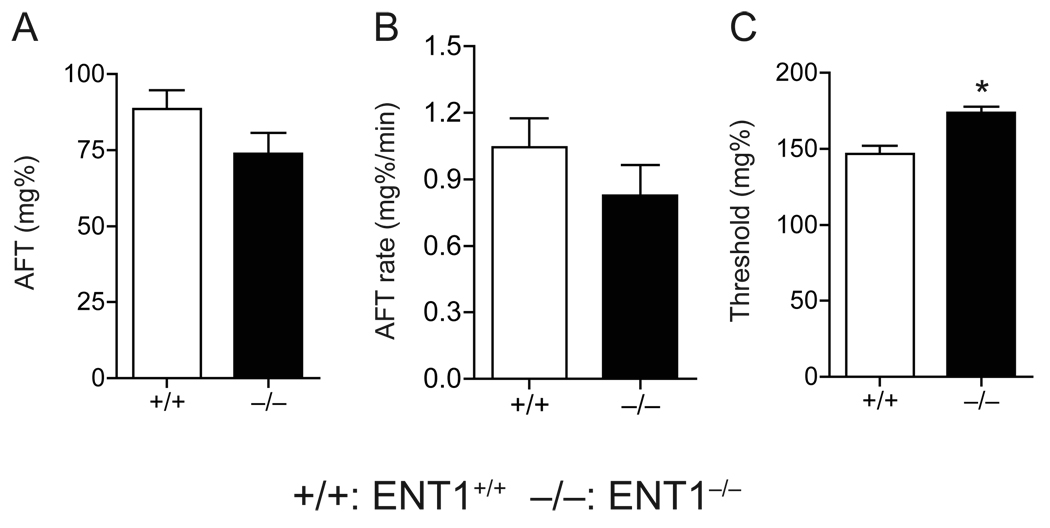
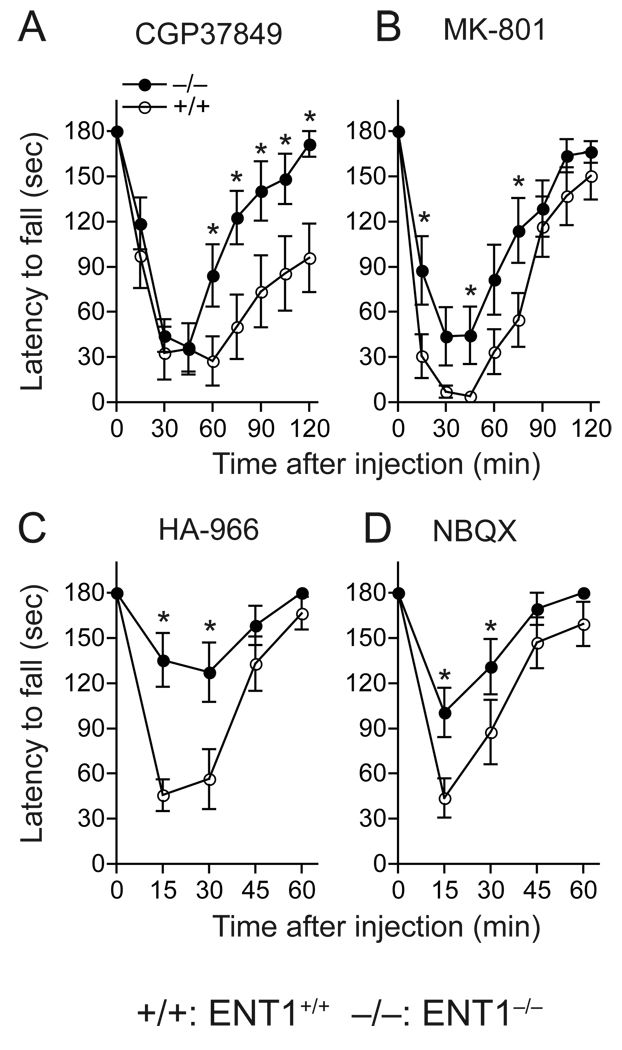
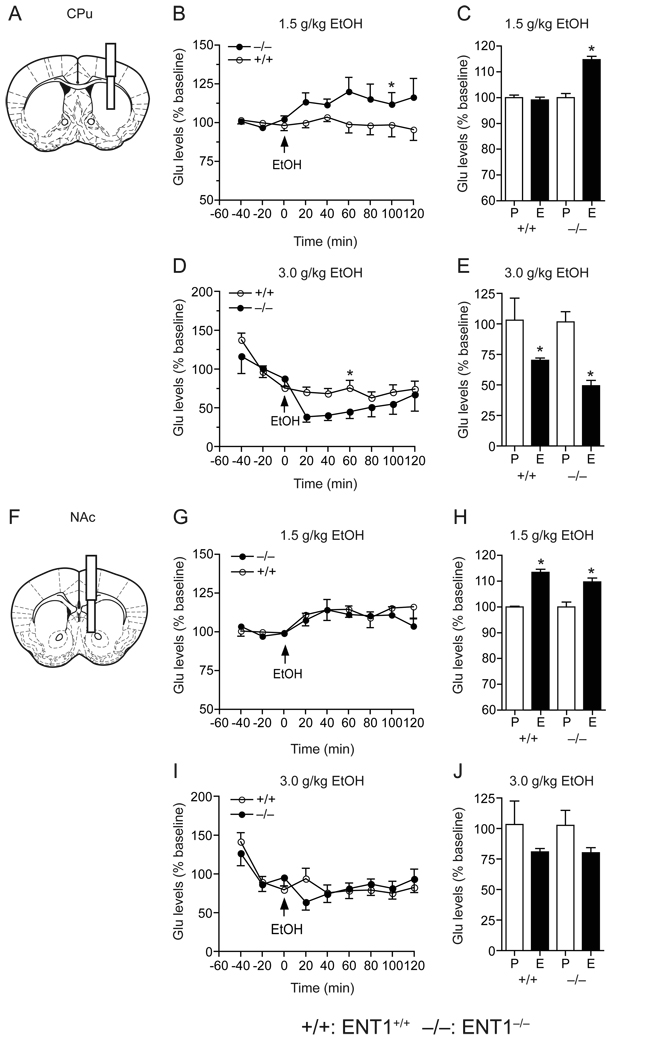
Alcohol-sensitive type 1 equilibrative nucleoside transporter (ENT1) regulates adenosine-mediated glutamate neurotransmission in the brain. Our behavioral studies suggest that the diminished aversive effects of ethanol and the increased resistance to acute ethanol intoxication in mice lacking ENT1, could be related to increased voluntary ethanol self-seeking behavior. In addition, we found that ENT1 null mice were resistant to the ataxic effects of glutamate antagonists when tested on a rotarod. Using microdialysis experiments, we examined glutamate levels in the dorsal and ventral striatum in response to ethanol. In the dorsal striatum of ENT1 null mice, a low intoxicating dose of ethanol (1.5 g/kg) induced a greater increase of glutamate levels, while a higher hypnotic dose of ethanol (3.0 g/kg) decreased to a lesser degree the glutamate levels, compared with that of wild-type mice. In the ventral striatum, however, the low (1.5 g/kg) and the high (3.0 g/kg) ethanol doses altered glutamate levels similarly in both genotypes. Our results suggest that adenosine-regulated glutamatergic signaling contributes to a reduced level of alcohol response, which might be associated with a higher susceptibility for alcoholism in humans.


Figures

Fig. 1
Fig. 1
Conditioned place preference and aversion in response to ethanol. (A) ENT1−/− mice (−/−) showed similar levels of ethanol reward as compared to ENT1+/+ mice (+/+). At doses of 1.5 and 2.0 g/kg (i.p.), ethanol developed conditioned place preference in both genotypes. There was no significant difference in preference scores between genotypes (n = 12 for each genotype; *p < 0.05 compared to pretest by Tukey tests). (B) Absence of ethanol-induced aversion in ENT1−/− mice. Ethanol (1.5 g/kg, i.p.) produced a significant conditioned place aversion in ENT1+/+ mice, but this was not altered in ENT1−/− mice (n = 10 for each genotype; *p < 0.05 compared to pretest by Tukey tests). Data are presented as mean ± s.e.m.
Fig. 2
Fig. 2
Operant ethanol self-administration. (A) Similar sucrose acquisition (FR = 3) between genotypes. (B) Similar self-administration for 10% sucrose (10S) and 10% sucrose/10% ethanol (10S10E) between genotypes. ENT1−/− mice (n = 6) showed significantly higher rates of lever pressing than did ENT1+/+ mice (n = 7) when 10% ethanol was added to the 5% sucrose (5S10E) or 10% ethanol alone in water (10E) (*p < 0.05 compared to ENT1+/+ mice by two-tailed t test). Data are presented as mean ± s.e.m.
Fig. 3
Fig. 3
Ethanol-induced spontaneous locomotor stimulation. (A) Basal locomotor activity was similar between genotypes (n = 11 for each genotype). (B) Acute ethanol (1.5 g/kg, i.p. in saline) induced an increase in locomotor activity in ENT1−/− mice, but not in ENT1+/+ mice (+/+) (n = 12 for each genotype; *p < 0.05 compared to EtOH-treated group by unpaired two-tailed t-test). Data are presented as mean ± s.e.m.
Fig. 4
Fig. 4
Acute functional tolerance (AFT) using a dowel test. The magnitude of AFT (A) and the rate at which AFT develops (B) were similar between genotypes. (C) The level of initial sensitivity is higher in ENT1−/− mice (n = 10) compared to ENT1+/+ (n = 9). *p < 0.05 compared to ENT1+/+ group by unpaired two-tailed t-test). Data are presented as mean ± s.e.m.
Fig. 5
Fig. 5
Ataxic effect of glutamate receptor antagonists. (A) CGP37849. (B) MK-801. (C) HA-966. (D) NBQX. ENT1−/− mice (−/−) compared to ENT1+/+ mice (+/+) (n = 12 for each genotype; *p < 0.05 compared to ENT1+/+ group by Tukey test). Data are presented as mean ± s.e.m.
Fig. 6
Fig. 6
Extracellular glutamate concentrations in the CPu and NAc in response to ethanol. (A, F) Schematic diagrams showing the location of a guide cannula with a microdialysis probe inserted into the CPu (A) and the NAc (F). (B, C) In the CPu, a low dose of ethanol (1.5 g/kg) increased glutamate levels in ENT1−/− (n = 6) compared to ENT1+/+ (n = 8; *p < 0.05 compared to ENT1+/+ group by Tukey test). Average glutamate levels were increased in ENT1−/− mice (*p < 0.05 when compared pretreated phase (P) to ethanol-treated phase (E) by unpaired two-tailed t-test). (D, E) However, with a high dose of ethanol (3.0 g/kg), ENT1−/− mice (n = 10) were slightly more sensitive to ethanol-induced suppression of extracellular glutamate levels in the CPu, compared to ENT1+/+ group (n = 8; *p < 0.05 compared to ENT1+/+ group by Tukey test). Average glutamate levels were decreased in both genotypes (*p < 0.05 compared pretreated phase (P) to ethanol-treated phase (E) by unpaired two-tailed t-test) in the CPu. (G, H) In the NAc, a low dose of ethanol (1.5 g/kg) increased extracellular glutamate levels in both genotypes (n = 8 for each genotype). Average of glutamate levels were increased in both genotypes (*p < 0.05 compared pretreated phase (P) with ethanol-treated phase (E) by unpaired two-tailed t-test) in the NAc. (I, J) At a high dose (3.0 g/kg), ethanol failed to alter glutamate levels in both genotypes (ENT1−/− mice, n = 10 and ENT1+/+ mice, n = 8) Data are presented as mean ± s.e.m.

References

    1. Diamond I, Gordon AS. Cellular and molecular neuroscience of alcoholism. Physiol Rev. 1997;77:1–20. - PubMed
    1. Dunwiddie TV, Masino SA. The role and regulation of adenosine in the central nervous system. Annu Rev Neurosci. 2001;24:31–55. - PubMed
    1. Koob GF, Le Moal M. Neurobiology of Addiction. London: Elsevier; 2006.
    1. Nagy LE, Diamond I, Casso DJ, Franklin C, Gordon AS. Ethanol increases extracellular adenosine by inhibiting adenosine uptake via the nucleoside transporter. J Biol Chem. 1990;265:1946–1951. - PubMed
    1. Choi DS, Cascini MG, Mailliard W, Young H, Paredes P, McMahon T, Diamond I, Bonci A, Messing RO. The type 1 equilibrative nucleoside transporter regulates ethanol intoxication and preference. Nat Neurosci. 2004;7:855–861. - PubMed

Publication types

MeSH terms