

Automated multi-model reconstruction from single-particle electron microscopy data
- PMID: 20085819
- PMCID: PMC2841227
- DOI: 10.1016/j.jsb.2010.01.007
Automated multi-model reconstruction from single-particle electron microscopy data
Abstract
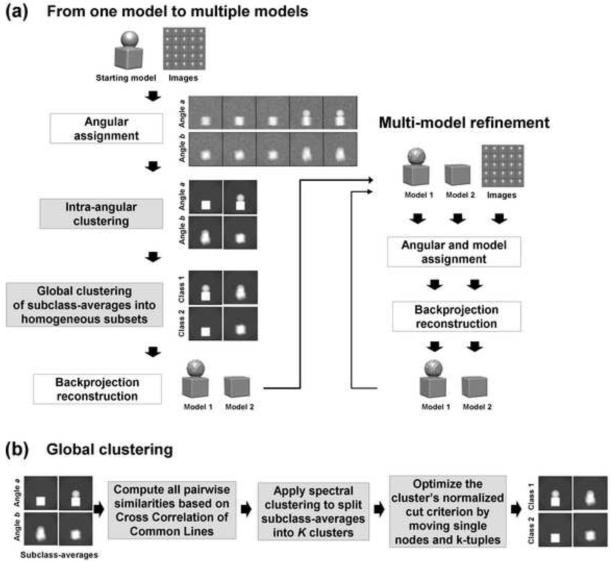
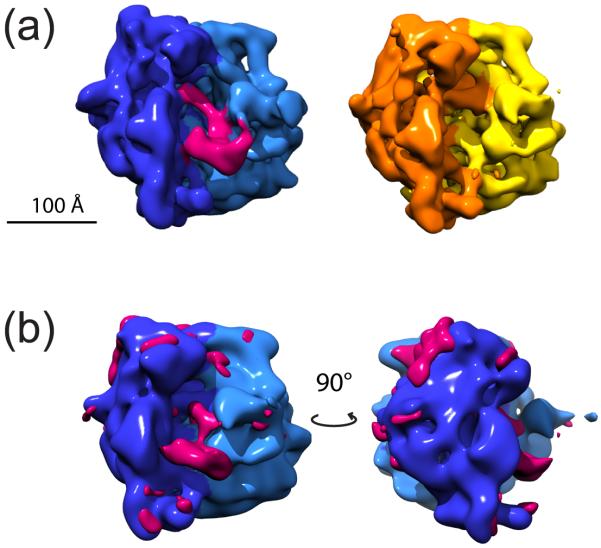
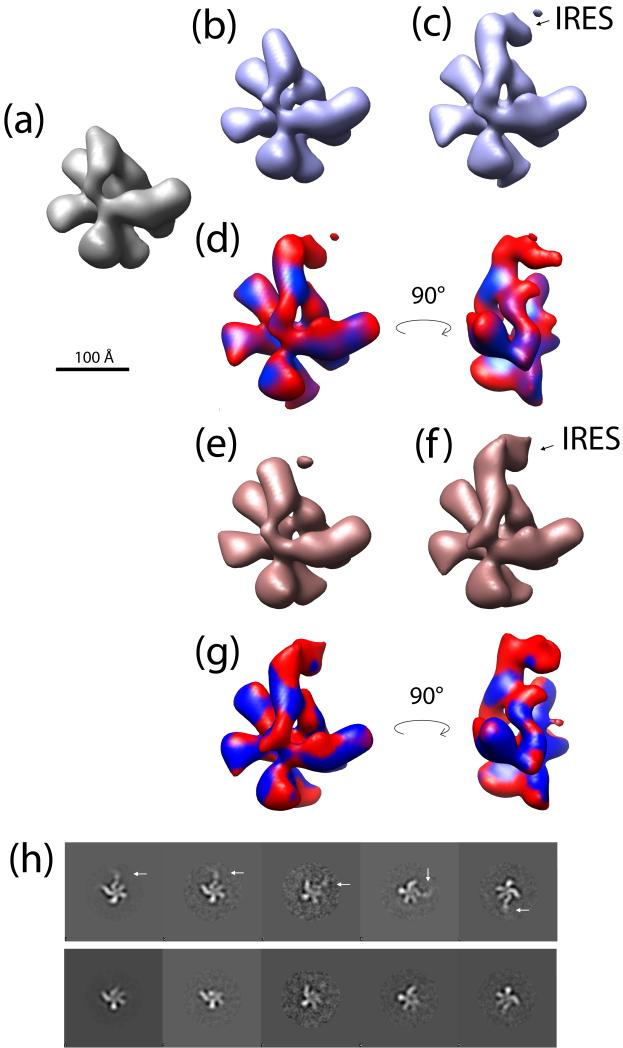
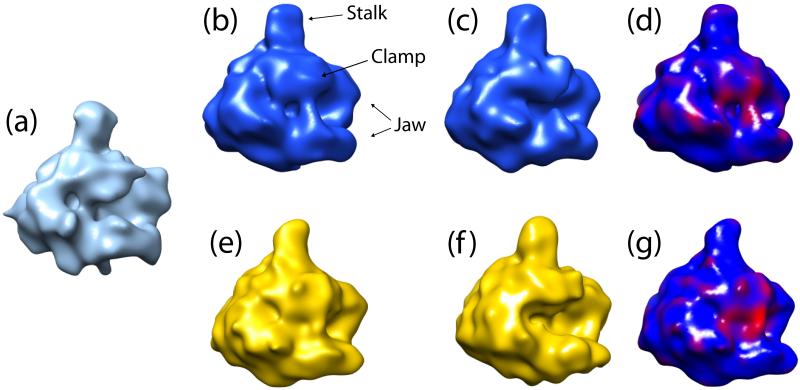
Biological macromolecules can adopt multiple conformational and compositional states due to structural flexibility and alternative subunit assemblies. This structural heterogeneity poses a major challenge in the study of macromolecular structure using single-particle electron microscopy. We propose a fully automated, unsupervised method for the three-dimensional reconstruction of multiple structural models from heterogeneous data. As a starting reference, our method employs an initial structure that does not account for any heterogeneity. Then, a multi-stage clustering is used to create multiple models representative of the heterogeneity within the sample. The multi-stage clustering combines an existing approach based on Multivariate Statistical Analysis to perform clustering within individual Euler angles, and a newly developed approach to sort out class averages from individual Euler angles into homogeneous groups. Structural models are computed from individual clusters. The whole data classification is further refined using an iterative multi-model projection-matching approach. We tested our method on one synthetic and three distinct experimental datasets. The tests include the cases where a macromolecular complex exhibits structural flexibility and cases where a molecule is found in ligand-bound and unbound states. We propose the use of our approach as an efficient way to reconstruct distinct multiple models from heterogeneous data.
(c) 2010 Elsevier Inc. All rights reserved.
Figures
Similar articles
-
Optimod--an automated approach for constructing and optimizing initial models for single-particle electron microscopy.J Struct Biol. 2013 Dec;184(3):417-26. doi: 10.1016/j.jsb.2013.10.009. Epub 2013 Oct 24. J Struct Biol. 2013. PMID: 24161732 Free PMC article.
-
A method for the alignment of heterogeneous macromolecules from electron microscopy.J Struct Biol. 2009 Apr;166(1):67-78. doi: 10.1016/j.jsb.2008.12.008. Epub 2008 Dec 30. J Struct Biol. 2009. PMID: 19166941 Free PMC article.
-
Single-particle reconstruction of biological macromolecules in electron microscopy--30 years.Q Rev Biophys. 2009 Aug;42(3):139-58. doi: 10.1017/S0033583509990059. Q Rev Biophys. 2009. PMID: 20025794 Free PMC article. Review.
-
IPET and FETR: experimental approach for studying molecular structure dynamics by cryo-electron tomography of a single-molecule structure.PLoS One. 2012;7(1):e30249. doi: 10.1371/journal.pone.0030249. Epub 2012 Jan 24. PLoS One. 2012. PMID: 22291925 Free PMC article.
-
Determining the structure of biological macromolecules by transmission electron microscopy, single particle analysis and 3D reconstruction.Prog Biophys Mol Biol. 2001;75(3):121-64. doi: 10.1016/s0079-6107(01)00004-9. Prog Biophys Mol Biol. 2001. PMID: 11376797 Review.
Cited by
-
Almost lost in translation. Cryo-EM of a dynamic macromolecular complex: the ribosome.Eur Biophys J. 2011 May;40(5):589-97. doi: 10.1007/s00249-011-0683-6. Epub 2011 Feb 19. Eur Biophys J. 2011. PMID: 21336521 Review.
-
Likelihood-based classification of cryo-EM images using FREALIGN.J Struct Biol. 2013 Sep;183(3):377-388. doi: 10.1016/j.jsb.2013.07.005. Epub 2013 Jul 17. J Struct Biol. 2013. PMID: 23872434 Free PMC article.
-
Separating distinct structures of multiple macromolecular assemblies from cryo-EM projections.J Struct Biol. 2020 Jan 1;209(1):107416. doi: 10.1016/j.jsb.2019.107416. Epub 2019 Nov 11. J Struct Biol. 2020. PMID: 31726096 Free PMC article.
-
Structural insights into transcriptional repression by noncoding RNAs that bind to human Pol II.J Mol Biol. 2013 Oct 9;425(19):3639-48. doi: 10.1016/j.jmb.2012.08.024. Epub 2012 Sep 4. J Mol Biol. 2013. PMID: 22954660 Free PMC article.
-
Cryo-EM reconstruction of continuous heterogeneity by Laplacian spectral volumes.Inverse Probl. 2020 Feb;36(2):024003. doi: 10.1088/1361-6420/ab4f55. Epub 2020 Jan 28. Inverse Probl. 2020. PMID: 32394996 Free PMC article.
References
-
- Beese LS, Friedman JM, Steitz TA. Crystal structures of the Klenow fragment of DNA polymerase I complexed with deoxynucleoside triphosphate and pyrophosphate. Biochemistry. 1993;32:14095–101. - PubMed
-
- Borland L, van Heel M. Classification of image data in conjugate representation spaces. J. Opt. Soc. Am. 1990;A7:601.
-
- Brink J, Ludtke SJ, Kong Y, Wakil SJ, Ma J, Chiu W. Experimental Verification of Conformational Variation of Human Fatty Acid Synthase as Predicted by Normal Mode Analysis. Structure. 2004;12:185–191. - PubMed
-
- Burgess SA, Walker ML, Thirumurugan K, Trinick J, Knight PJ. Use of negative stain and single-particle image processing to explore dynamic properties of flexible macromolecules. Journal of Structural Biology. 2004;147:247–258. - PubMed
-
- Cheetham GMT, Jeruzalmi D, Steitz TA. Structural basis for initiation of transcription from an RNA polymerase-promoter complex. 1999;399:80–83. - PubMed
Publication types
MeSH terms
Substances
Grants and funding
LinkOut - more resources
Full Text Sources
Research Materials
