Comparative Study
. 2010 Feb;133(Pt 2):433-47.
doi: 10.1093/brain/awp322. Epub 2010 Jan 19.

Quantitative analysis of cellular inflammation after traumatic spinal cord injury: evidence for a multiphasic inflammatory response in the acute to chronic environment

Affiliations
Comparative Study

Quantitative analysis of cellular inflammation after traumatic spinal cord injury: evidence for a multiphasic inflammatory response in the acute to chronic environment

Kevin D Beck et al. Brain. 2010 Feb.

Abstract

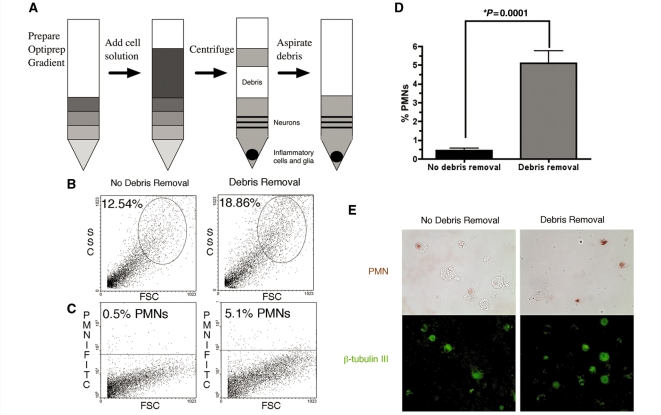
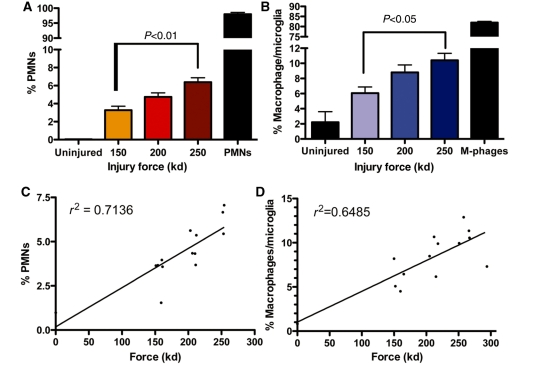
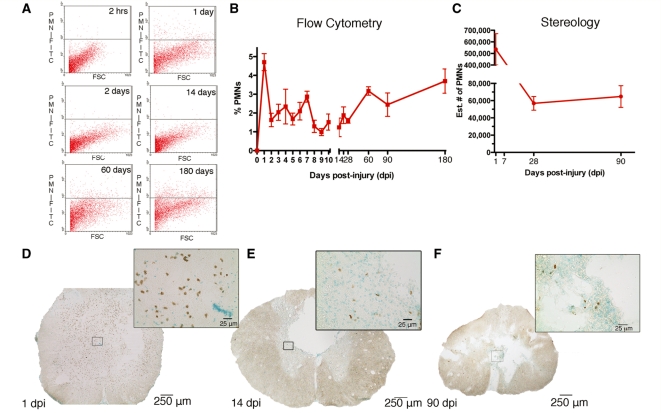
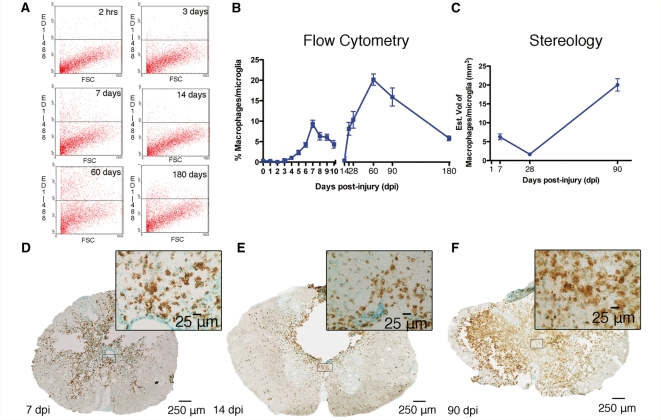
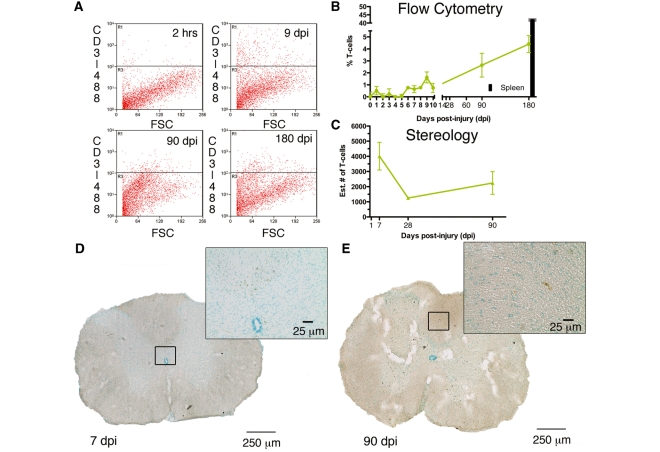
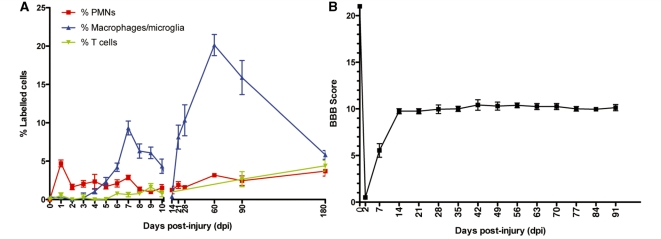
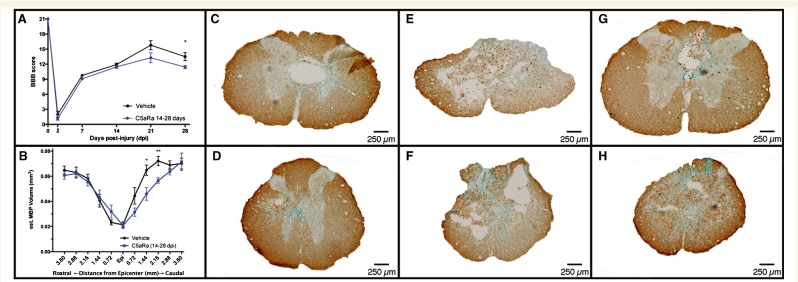
Traumatic injury to the central nervous system results in the disruption of the blood brain/spinal barrier, followed by the invasion of cells and other components of the immune system that can aggravate injury and affect subsequent repair and regeneration. Although studies of chronic neuroinflammation in the injured spinal cord of animals are clinically relevant to most patients living with traumatic injury to the brain or spinal cord, very little is known about chronic neuroinflammation, though several studies have tested the role of neuroinflammation in the acute period after injury. The present study characterizes a novel cell preparation method that assesses, quickly and effectively, the changes in the principal immune cell types by flow cytometry in the injured spinal cord, daily for the first 10 days and periodically up to 180 days after spinal cord injury. These data quantitatively demonstrate a novel time-dependent multiphasic response of cellular inflammation in the spinal cord after spinal cord injury and are verified by quantitative stereology of immunolabelled spinal cord sections at selected time points. The early phase of cellular inflammation is comprised principally of neutrophils (peaking 1 day post-injury), macrophages/microglia (peaking 7 days post-injury) and T cells (peaking 9 days post-injury). The late phase of cellular inflammation was detected after 14 days post-injury, peaked after 60 days post-injury and remained detectable throughout 180 days post-injury for all three cell types. Furthermore, the late phase of cellular inflammation (14-180 days post-injury) did not coincide with either further improvements, or new decrements, in open-field locomotor function after spinal cord injury. However, blockade of chemoattractant C5a-mediated inflammation after 14 days post-injury reduced locomotor recovery and myelination in the injured spinal cord, suggesting that the late inflammatory response serves a reparative function. Together, these data provide new insight into cellular inflammation of spinal cord injury and identify a surprising and extended multiphasic response of cellular inflammation. Understanding the role of this multiphasic response in the pathophysiology of spinal cord injury could be critical for the design and implementation of rational therapeutic treatment strategies, including both cell-based and pharmacological interventions.


Figures

Figure 1
Figure 1
OptiPrep gradient densities separate most myelin and debris from injured spinal cord tissues/cells and improve immune cell assessment by flow cytometry. (A) Myelin and debris were separated from cells (neurons, glia and immune cells) after centrifugation of dissociated spinal cord tissue through an OptiPrep gradient, followed by aspiration of the myelin and debris layer. (B) Flow cytometric plots of spinal cord cells 1 dpi with or without debris removal by OptiPrep. Gradient densities show differences in FSC/SSC profile of cells. The region with FSC/SSC profiles distinctive to PMNs is indicated. (C and D) PMN number in the injured spinal cord, showing increased sensitivity in detecting PMNs after debris removal (Student’s t-test, *P = 0.0001). (E) However, cell samples in both preparations contain both PMNs and neurons (β-tubulin III+). All flow cytometric gates were set using labelled cells from uninjured animals; n = 5 per group, mean ± SEM.
Figure 2
Figure 2
Debris removal procedure provides the ability to discern differences in cellular inflammation between rats that received graded injuries. The sensitivity of flow cytometry to detect differences in cellular inflammation was confirmed by giving rats mild (150 kd), moderate (200 kd) or severe (250 kd) spinal cord injury before assessing spinal cord tissue for (A) PMNs (1 dpi) or (B) ED1+ macrophage/microglial (7 dpi) cell number. One-way ANOVA detected changes over time in PMN [ANOVA: F(3,10): 22.90, P < 0.0001] and ED1+ macrophages/microglia [ANOVA: F(3,11): 10.15, P < 0.0017]. Tukey’s post hoc multiple comparison tests detected differences in cell counts between mild and severe injuries for both PMNs (P < 0.01) and ED1+ macrophages/microglia (P < 0.05). Injury force positively correlated with (C) PMN infiltration (all animals: r2 = 0.71; injured animals only: r2 = 0.67) and (D) ED1+ macrophage/microglial infiltration (all animals: r2 = 0.65; injured animals only: r2 = 0.40). n = 3–5 per group, mean ± SEM.
Figure 3
Figure 3
Assessment of PMNs in the spinal cord following a moderate (200 kd) contusion injury at T9. (A and B) PMNs quickly entered the spinal cord with an acute peak at 1 dpi, before falling to lower levels at 14 dpi, and peaked a second time at 60 dpi. One-way ANOVA confirmed differences in PMN infiltration over time [ANOVA: F(16,62) = 6.789, P < 0.0001]. (C) An acute peak and the chronic presence of PMNs were confirmed by quantitative stereology. Select Bonferroni’s multiple comparison tests are reported in Table 1. Immunohistology confirmed PMN presence in the spinal cord at (D) 1 dpi, (E) 14 dpi and (F) 90 dpi. Spinal cord sections were labelled with anti-PMN antibody (brown) and methyl green nuclear counterstain. PMNs at both time points aggregate around areas of cavitation near the injury epicentre. n = 3–5 per group, mean ± SEM.
Figure 4
Figure 4
Assessment of ED1+ macrophages/microglia in the spinal cord by flow cytometry following a moderate (200 kd) contusion injury at T9. (A and B) Number of ED1+ macrophages/microglia increased in the injured spinal cord starting at 3 dpi, peaked acutely at 7 dpi, dropped to low levels at 14 dpi, before rising to a second peak 60 dpi and remained in the injured spinal cord up to 180 dpi. One-way ANOVA confirmed differences in the number of ED1+ cells over time [ANOVA: F(16,63) = 31.29, P < 0.0001]. (C) Quantitative stereology confirmed both the acute and chronic peaks of macrophage/microglia. Select Bonferroni’s multiple comparison tests are reported in Table 1. Immunohistology confirmed ED1+ macrophage/microglial presence (D) 7 dpi, (E) 14 dpi and (F) 90 dpi in the injured spinal cord. Spinal cord sections were labelled with anti-ED1 antibody (brown) and methyl green nuclear counterstain. n = 3–5 per group, mean ± SEM.
Figure 5
Figure 5
Assessment of T cells in the spinal cord by flow cytometry following a moderate (200 kd) contusion injury at T9. (A) CD3+ T cells were minimal immediately following injury, reaching an acute peak 9 dpi. A prolonged T cell presence was detected up to 180 dpi. (B) The number of CD3+ T cells in the injured spinal cord changed over time [ANOVA: F(13,52) = 9.449, P < 0.0001]. A non-significant acute peak of CD3+ T cell presence was observed 9 dpi followed by a chronic T cell response persisting to at least 180 dpi. (C) An acute peak and the chronic presence of CD3+ T cells were confirmed by quantitative stereology. Select Bonferroni’s multiple comparison tests are reported in Table 1. Immunohistology with anti-CD3 antibody (brown) confirmed a limited number of T cells in the injured spinal cord at (D) 7 dpi and (E) 90 dpi; T cells were only detected in a few spinal cord sections. T cell occupation of the spinal cord was low compared to other cell types, with many T cells confined to the vasculature not far from the injury epicentre. n = 3–5 per group, mean ± SEM.
Figure 6
Figure 6
Chronic inflammation is not linked with changes in functional recovery. (A) A time course of cellular inflammation in the spinal cord following a moderate (200 kd) contusion injury at T9. As assessed by flow cytometry, numbers of PMNs, ED1+ macrophages/microglia and CD3+ T cells peaked acutely (1, 7 and 9 dpi, respectively) and persisted chronically in the injured spinal cord. (B) Locomotor performance on the BBB scale did not change during periods of chronic inflammation within the injured spinal cord. n = 5–8 per group, mean ± SEM.
Figure 7
Figure 7
Rats received 200 kd T9 contusion spinal cord injury and were tested for openfield locomotor recovery. (A) Animals treated with C5aRa from 14 to 28 dpi showed significantly less functional recovery 28 dpi than controls. Repeated-measures ANOVA found significant main effects of drug treatment (P = 0.027), time (P < 0.0001) and drug treatment × time interaction (P = 0.030). Bonferroni post hoc tests found the C5aRa-treated group had significantly higher BBB scores at 21 and 28 dpi (P < 0.01 and P < 0.05, respectively). (B) C5aRa-treated rats had significantly less intact myelin in regions caudal to the injury epicentre than vehicle-treated controls (two-tailed t-test, *P = 0.0162, **P = 0.0042). Representative images of sections 1.44 mm rostral to epicentre, the injury epicentre and 1.44 mm caudal to epicentre are shown for vehicle (C, E and G) and C5aRa-treated rats (D, F and H).

Similar articles

Cited by

References

    1. Anderson AJ, Robert S, Huang W, Young W, Cotman CW. Activation of complement pathways after contusion-induced spinal cord injury. J Neurotrauma. 2004;21:1831–46. - PubMed
    1. Anderson AJ, Su JH, Cotman CW. DNA damage and apoptosis in Alzheimer’s disease: colocalization with c-Jun immunoreactivity, relationship to brain area, and effect of postmortem delay. J Neurosci. 1996;16:1710–9. - PMC - PubMed
    1. Ankeny DP, Guan Z, Popovich PG. B cells produce pathogenic antibodies and impair recovery after spinal cord injury in mice. J Clin Invest. 2009;119:2990–9. - PMC - PubMed
    1. Arnold L, Henry A, Poron F, Baba-Amer Y, van Rooijen N, Plonquet A, et al. Inflammatory monocytes recruited after skeletal muscle injury switch into antiinflammatory macrophages to support myogenesis. J Exp Med. 2007;204:1057–69. - PMC - PubMed
    1. Bagamery K, Kvell K, Landau R, Graham J. Flow cytometric analysis of CD41-labeled platelets isolated by the rapid, one-step OptiPrep method from human blood. Cytometry A. 2005;65:84–7. - PubMed

Publication types

MeSH terms

Substances