

Transient hyperoxic reoxygenation reduces cytochrome C oxidase activity by increasing superoxide dismutase and nitric oxide
- PMID: 20086011
- PMCID: PMC2856994
- DOI: 10.1074/jbc.M109.053181
Transient hyperoxic reoxygenation reduces cytochrome C oxidase activity by increasing superoxide dismutase and nitric oxide
Abstract
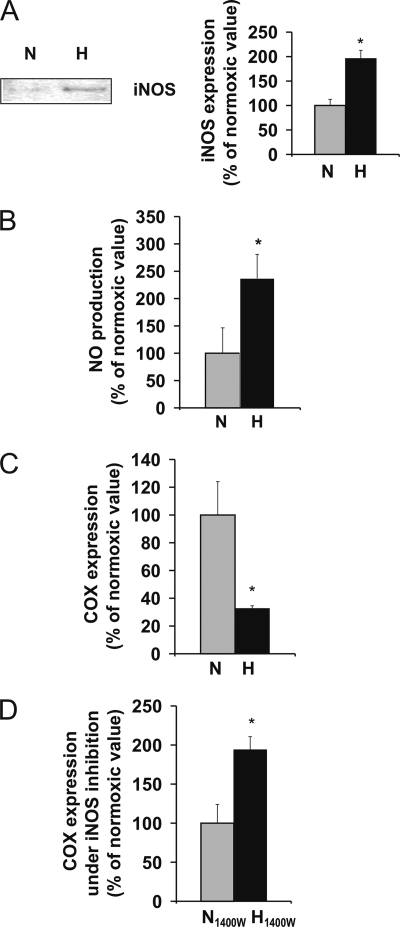
Oxygen therapies have been shown to be cytoprotective in a dose-dependent fashion. Previously, we have characterized the protective effects of moderate hyperoxia on cell viability of ischemic human cardiomyocytes and their mitochondrial membrane potential by transient addition of oxygenated perfluorocarbons to the cell medium. Now, we report that the activity and expression of cytochrome c oxidase (COX) after prolonged ischemia depend on the amount of oxygen delivered during reoxygenation. Transient hyperoxia during reoxygenation results in a decrease of COX activity by 62 +/- 15% and COX expression by 67 +/- 5%, when hyperoxic tensions of approximately = 300 mm Hg are reached in the cell medium. This decrease in COX expression is prevented by the inhibition of inducible nitric-oxide synthase (iNOS). Immunoblot analysis of ischemic human cardiomyocytes revealed that hyperoxic reoxygenation causes a 2-fold increase of iNOS, leading to a rise in nitric oxide production by 140 +/- 45%. Hyperoxic reoxygenation is further responsible for a 2-fold activation of hydrogen peroxide production and an increase in cytosolic superoxide dismutase expression by 35 +/- 10%. NADPH availability has no effect on the hyperoxia-induced decrease of superoxide. Overall, these results indicate that transient hyperoxic reoxygenation in optimal concentrations increases the level of nitric oxide by activation of iNOS and superoxide dismutase, thereby inducing respiration arrest in mitochondria of ischemic cardiomyocytes.
Figures


Similar articles
-
Hypoxic challenge of hyperoxic pulmonary artery myocytes increases oxidative stress due to impaired mitochondrial superoxide dismutase activity.Pulm Pharmacol Ther. 2018 Feb;48:195-202. doi: 10.1016/j.pupt.2017.12.003. Epub 2017 Dec 12. Pulm Pharmacol Ther. 2018. PMID: 29246840
-
Effects of hyperoxia on nitric oxide synthase expression, nitric oxide activity, and lung injury in rat pups.Pediatr Res. 1999 Jan;45(1):8-13. doi: 10.1203/00006450-199901000-00003. Pediatr Res. 1999. PMID: 9890602
-
Oxygenated perfluorochemicals improve cell survival during reoxygenation by pacifying mitochondrial activity.J Pharmacol Exp Ther. 2008 May;325(2):417-24. doi: 10.1124/jpet.107.133710. Epub 2008 Feb 27. J Pharmacol Exp Ther. 2008. PMID: 18305017
-
Nitric oxide, cytochrome c and mitochondria.Biochem Soc Symp. 1999;66:17-25. doi: 10.1042/bss0660017. Biochem Soc Symp. 1999. PMID: 10989653 Review.
-
Regulation of mitochondrial respiration by nitric oxide inhibition of cytochrome c oxidase.Biochim Biophys Acta. 2001 Mar 1;1504(1):46-57. doi: 10.1016/s0005-2728(00)00238-3. Biochim Biophys Acta. 2001. PMID: 11239484 Review.
Cited by
-
The Role of Pi, Glutamine and the Essential Amino Acids in Modulating the Metabolism in Diabetes and Cancer.J Diabetes Metab Disord. 2020 Aug 19;19(2):1731-1775. doi: 10.1007/s40200-020-00566-5. eCollection 2020 Dec. J Diabetes Metab Disord. 2020. PMID: 33520860 Free PMC article. Review.
-
The nitric oxide donor, (Z)-1-[N-(2-aminoethyl)-N-(2-ammonioethyl)amino]diazen-1-ium-1,2-diolate (DETA-NONOate/D-NO), increases survival by attenuating hyperoxia-compromised innate immunity in bacterial clearance in a mouse model of ventilator-associated pneumonia.Biochem Pharmacol. 2020 Jun;176:113817. doi: 10.1016/j.bcp.2020.113817. Epub 2020 Jan 20. Biochem Pharmacol. 2020. PMID: 31972169 Free PMC article.
-
Fluorine-Incorporated Biogenic Hydroxyapatite Enhances Socket Bone Healing via Addressing Macrophage-Mediated Inflammatory Response.Bioengineering (Basel). 2025 Apr 7;12(4):396. doi: 10.3390/bioengineering12040396. Bioengineering (Basel). 2025. PMID: 40281756 Free PMC article.
-
Proteomic analysis of mitochondrial proteins in the guinea pig heart following long-term normobaric hyperoxia.Mol Cell Biochem. 2017 Oct;434(1-2):61-73. doi: 10.1007/s11010-017-3037-6. Epub 2017 Apr 21. Mol Cell Biochem. 2017. PMID: 28432557
References
-
- Helms A. K., Whelan H. T., Torbey M. T. (2005) Cerebrovasc. Dis. 20, 417–426 - PubMed
-
- Eschenfelder C. C., Krug R., Yusofi A. F., Meyne J. K., Herdegen T., Koch A., Zhao Y., Carl U. M., Deuschl G. (2008) Cerebrovasc. Dis. 25, 193–201 - PubMed
-
- Reznik O. N., Bagnenko S. F., Loginov I. V., Iljina V. A., Ananyev A. N., Moysyuk Y. G. (2008) Transplant. Proc. 40, 1027–1028 - PubMed
-
- Barth E., Stämmler G., Speiser B., Schaper J. (1992) J. Mol. Cell. Cardiol. 24, 669–681 - PubMed
-
- Cai J., Jones D. P. (1998) J. Biol. Chem. 273, 11401–11404 - PubMed
MeSH terms
Substances
LinkOut - more resources
Full Text Sources
