. 2010 Apr;333(1):140-51.
doi: 10.1124/jpet.109.162271. Epub 2010 Jan 19.

Nuclear factor erythroid 2-related factor 2 deletion impairs glucose tolerance and exacerbates hyperglycemia in type 1 diabetic mice

Affiliations

Nuclear factor erythroid 2-related factor 2 deletion impairs glucose tolerance and exacerbates hyperglycemia in type 1 diabetic mice

Lauren M Aleksunes et al. J Pharmacol Exp Ther. 2010 Apr.

Abstract

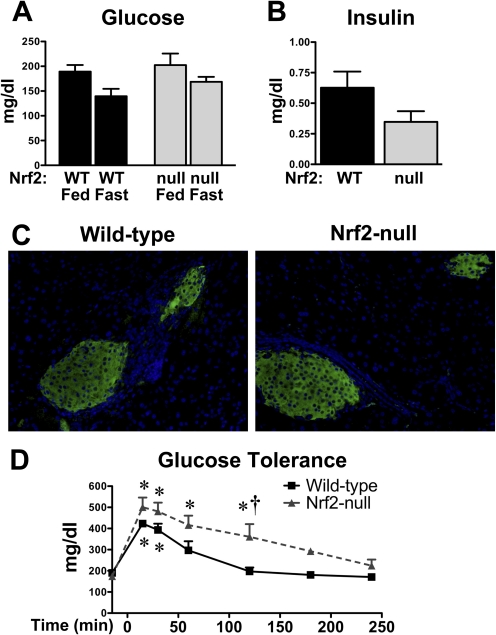
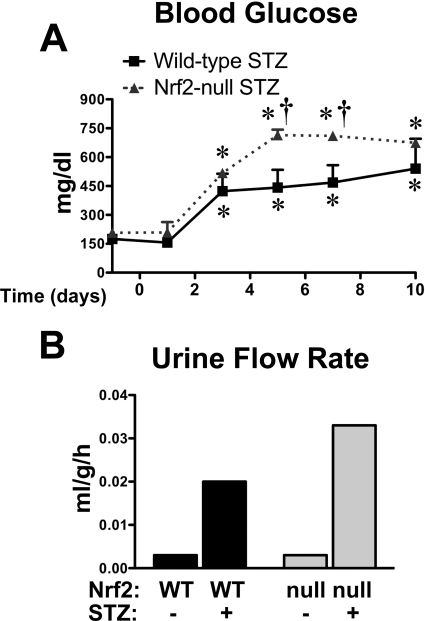
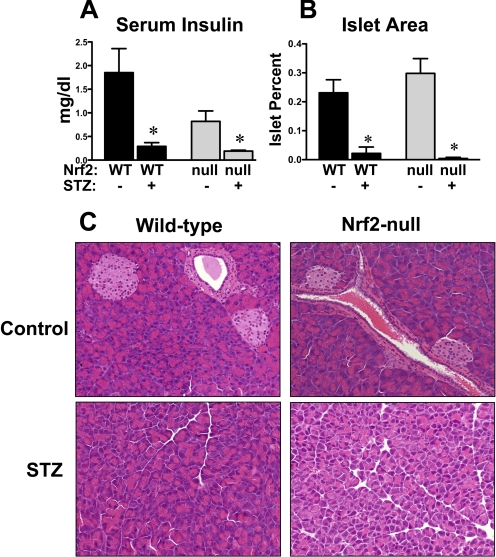
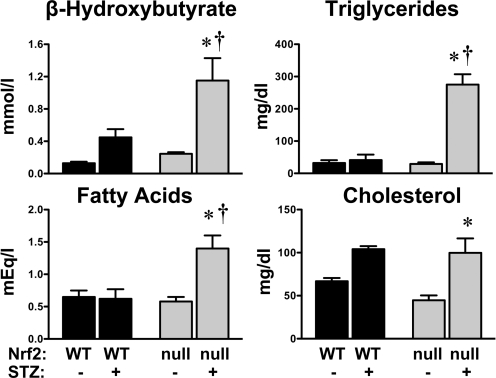
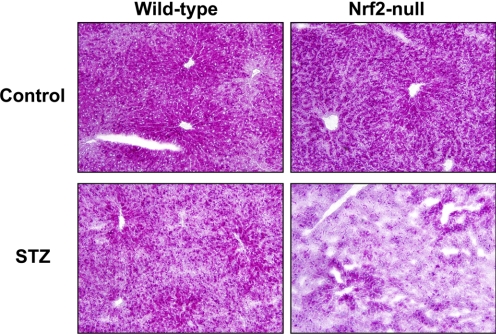
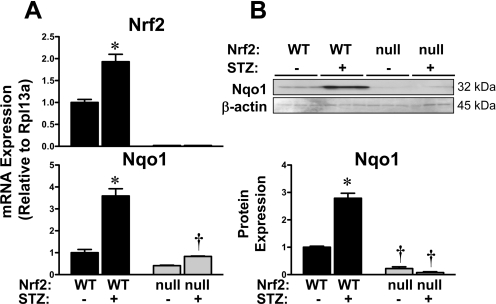
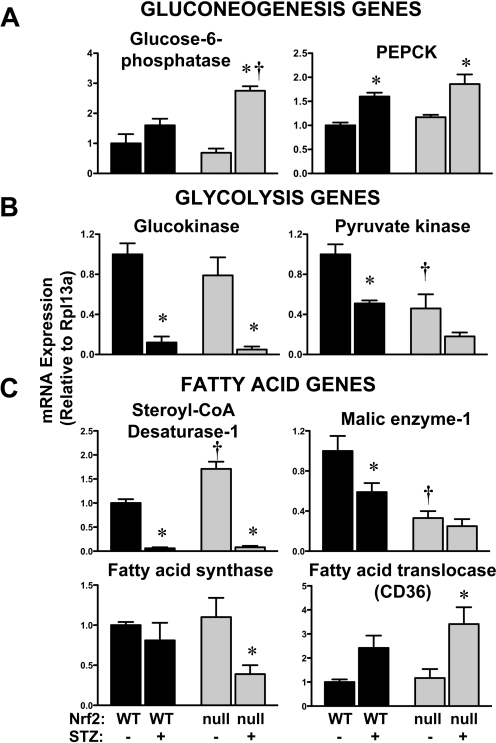
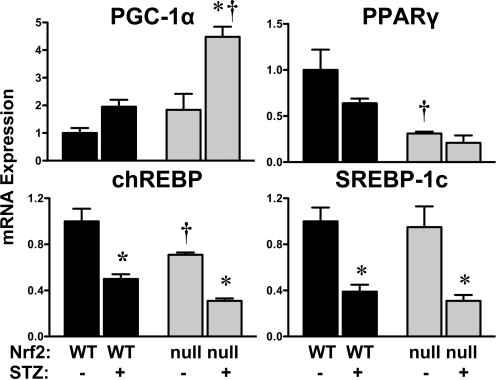
The transcription factor nuclear factor erythroid 2-related factor 2 (Nrf2) induces a battery of cytoprotective genes after oxidative stress. Nrf2 aids in liver regeneration by altering insulin signaling; however, whether Nrf2 participates in hepatic glucose homeostasis is unknown. Compared with wild-type mice, mice lacking Nrf2 (Nrf2-null) have lower basal serum insulin and prolonged hyperglycemia in response to an intraperitoneal glucose challenge. In the present study, blood glucose, serum insulin, urine flow rate, and hepatic expression of glucose-related genes were quantified in male diabetic wild-type and Nrf2-null mice. Type 1 diabetes was induced with a single intraperitoneal dose (200 mg/kg) of streptozotocin (STZ). Histopathology and serum insulin levels confirmed depleted pancreatic beta-cells in STZ-treated mice of both genotypes. Five days after STZ, Nrf2-null mice had higher blood glucose levels than wild-type mice. Nine days after STZ, polyuria occurred in both genotypes with more urine output from Nrf2-null mice (11-fold) than wild-type mice (7-fold). Moreover, STZ-treated Nrf2-null mice had higher levels of serum beta-hydroxybutyrate, triglycerides, and fatty acids 10 days after STZ compared with wild-type mice. STZ reduced hepatic glycogen in both genotypes, with less observed in Nrf2-null mice. Increased urine output and blood glucose in STZ-treated Nrf2-null mice corresponded with enhanced gluconeogenesis (glucose-6-phosphatase and phosphoenolpyruvate carboxykinase)- and reduced glycolysis (pyruvate kinase)-related mRNA expression in their livers. Furthermore, the Nrf2 activator oltipraz lowered blood glucose in wild-type but not Nrf2-null mice administered STZ. Collectively, these data indicate that the absence of Nrf2 worsens hyperglycemia in type I diabetic mice and Nrf2 may represent a therapeutic target for reducing circulating glucose levels.


Figures

Fig. 1.
Fig. 1.
Blood glucose and serum and pancreatic insulin in wild-type and Nrf2-null mice. A, blood glucose levels in fed and fasted WT and Nrf2-null mice. B, serum insulin levels in naive (fed) WT and Nrf2-null mice. C, indirect immunofluorescent staining of insulin (green) in paraffin-embedded pancreatic sections (5 μm) from WT and Nrf2-null mice. Nuclei are stained with 4′,6-diamidino-2-phenylindole (blue). Magnification, 400×. D, serial blood glucose levels in WT and Nrf2-null mice after a bolus intraperitoneal injection of 20% glucose. Data are presented as mean ± S.E. (n = 3–6). Black bars represent wild-type mice, and gray bars represent Nrf2-null mice. Asterisks (∗) represent statistically significant differences (p < 0.05) compared with baseline glucose levels (−15 min) for each genotype. Daggers (†) represent a statistically significant difference (p < 0.05) between wild-type and Nrf2-null mice at that time point.
Fig. 2.
Fig. 2.
Blood glucose and urinary flow rate of wild-type and Nrf2-null mice after STZ. A, blood glucose levels in STZ-treated wild-type and Nrf2-null mice from days −1 to 10. STZ was administered on day 0. Day −1 blood glucose levels represent pretreatment values. Black bars represent wild-type mice, and gray bars represent Nrf2-null mice. Data are presented as mean ± S.E. (n = 4–6). Asterisks (∗) represent statistically significant differences (p < 0.05) compared with control mice for each genotype. Daggers (†) represent a statistically significant difference (p < 0.05) between wild-type and Nrf2-null mice at that time point. B, urinary flow rate of control and STZ-treated WT and Nrf2-null mice on day 9. Urine volume was quantified from three mice per group housed in a single metabolic cage (pooled urine) for 6 h and normalized to body weight and time. Black bars represent wild-type mice, and gray bars represent Nrf2-null mice.
Fig. 3.
Fig. 3.
Serum insulin and pancreatic histopathology in wild-type and Nrf2-null mice after STZ. A, serum insulin was quantified in control and STZ-treated wild-type and Nrf2-null mice on day 10 (n = 4–6). B, quantification of pancreatic islet area. Pancreatic sections (5 μm) were stained with hematoxylin and eosin. The percentage islet was calculated as the area of islet divided by the total area of tissue. Data are presented as mean ± S.E. Black bars represent wild-type mice, and gray bars represent Nrf2-null mice. Asterisks (∗) represent statistically significant differences (p < 0.05) compared with control mice of that genotype. C, histological morphology of pancreas sections from control and STZ-treated wild-type and Nrf2-null mice are shown. Magnification, 200×.
Fig. 4.
Fig. 4.
Serum analytes in wild-type and Nrf2-null mice after STZ. Serum β-hydroxybutyrate, triglycerides, nonesterified fatty acids, and cholesterol were quantified in control and STZ-treated wild-type and Nrf2-null mice on day 10. Data are presented as mean ± S.E. (n = 3–6). Black bars represent wild-type mice, and gray bars represent Nrf2-null mice. Asterisks (∗) represent statistically significant differences (p < 0.05) compared with control mice of that genotype. Daggers (†) represent a statistically significant difference (p < 0.05) from STZ-treated WT mice.
Fig. 5.
Fig. 5.
Hepatic glycogen staining in wild-type and Nrf2-null mice after STZ. Periodic acid-Schiff staining for glycogen (dark pink) was performed on hepatic cryosections (5 μm) from control and STZ-treated wild-type and Nrf2-null mice on day 10. Magnification, 200×.
Fig. 6.
Fig. 6.
Hepatic mRNA and protein expression of Nrf2 and target gene Nqo1 in wild-type and Nrf2-null mice after STZ. A, messenger RNA expression of Nrf2 and Nqo1 were quantified using total hepatic RNA from control and STZ-treated wild-type and Nrf2-null mice on day 10. B, Western immunoblots were performed using the cytosol fraction from control and STZ-treated wild-type and Nrf2-null mice on day 10. Western blot data were quantified. Data were normalized to wild-type controls and presented as mean relative expression ± S.E. Black bars represent wild-type mice, and gray bars represent Nrf2-null mice. Asterisks (∗) represent statistically significant differences (p < 0.05) compared with control mice of that genotype. Daggers (†) represent a statistically significant difference (p < 0.05) between wild-type and Nrf2-null mice with the same treatment.
Fig. 7.
Fig. 7.
Hepatic mRNA expression of glucose- and fatty acid-related genes in wild-type and Nrf2-null mice after STZ. Total RNA isolated from livers of control and STZ-treated wild-type and Nrf2-null mice on day 10 were evaluated for mRNA expression of gluconeogenesis genes glucose-6-phosphatase and PEPCK (A); glycolysis genes glucokinase and liver-type pyruvate kinase (B); and fatty acid synthesis/metabolism genes stearoyl-CoA desaturase-1, malic enzyme-1, fatty acid synthase, and fatty acid translocase (CD36) (C). Data were normalized to wild-type controls and presented as mean relative expression ± S.E. (n = 3–6). Black bars represent wild-type mice, and gray bars represent Nrf2-null mice. Asterisks (∗) represent statistically significant differences (p < 0.05) compared with control mice of that genotype. Daggers (†) represent a statistically significant difference (p < 0.05) between wild-type and Nrf2-null mice with the same treatment.
Fig. 8.
Fig. 8.
Hepatic mRNA expression of transcription factors in wild-type and Nrf2-null mice after STZ. Total RNA isolated from livers of control and STZ-treated wild-type and Nrf2-null mice on day 10 were evaluated for mRNA expression of PGC1α, PPARγ, chREBP, and SREBP-1c. Data were normalized to wild-type controls and presented as mean relative expression ± S.E. (n = 3–4). Black bars represent wild-type mice, and gray bars represent Nrf2-null mice. Asterisks (∗) represent statistically significant differences (p < 0.05) compared with control mice of that genotype. Daggers (†) represent a statistically significant difference (p < 0.05) between wild-type and Nrf2-null mice with the same treatment.
Fig. 9.
Fig. 9.
Effect of oltipraz on blood glucose levels of wild-type mice after STZ. Blood glucose levels were quantified on days −1, 1, 3, 5, 7, 9, and 10 in wild-type mice treated with citrate buffer or STZ (200 mg/kg i.p.) on day 0 and either corn oil (5 ml/kg) or oltipraz (150 mg/kg i.p.). Corn oil or oltipraz was administered on days 0.5 (12 h after STZ), 2, 4, 6, and 8. Day −1 blood glucose levels represent pretreatment values. Blood glucose levels were similar between citrate vehicle-only (148–184 mg/dl) and oltipraz-only (129–160 mg/dl) mice of both genotypes (data not shown). Data are presented as mean ± S.E. (n = 4). Asterisks (∗) represent statistically significant differences (p < 0.05) compared with control mice of that genotype. Daggers (†) represent a statistically significant difference (p < 0.05) from STZ-only treatment.

Similar articles

Cited by

References

    1. Aleksunes LM, Manautou JE. (2007) Emerging role of Nrf2 in protecting against hepatic and gastrointestinal disease. Toxicol Pathol 35:459–473 - PubMed
    1. Aleksunes LM, Slitt AL, Maher JM, Augustine LM, Goedken MJ, Chan JY, Cherrington NJ, Klaassen CD, Manautou JE. (2008) Induction of Mrp3 and Mrp4 transporters during acetaminophen hepatotoxicity is dependent on Nrf2. Toxicol Appl Pharmacol 226:74–83 - PMC - PubMed
    1. Bae EJ, Yang YM, Kim JW, Kim SG. (2007) Identification of a novel class of dithiolethiones that prevent hepatic insulin resistance via the adenosine monophosphate-activated protein kinase-p70 ribosomal S6 kinase-1 pathway. Hepatology 46:730–739 - PubMed
    1. Beyer TA, Xu W, Teupser D, auf dem Keller U, Bugnon P, Hildt E, Thiery J, Kan YW, Werner S. (2008) Impaired liver regeneration in Nrf2 knockout mice: role of ROS-mediated insulin/IGF-1 resistance. EMBO J 27:212–223 - PMC - PubMed
    1. da Silva Xavier G, Rutter GA, Diraison F, Andreolas C, Leclerc I. (2006) ChREBP binding to fatty acid synthase and L-type pyruvate kinase genes is stimulated by glucose in pancreatic beta-cells. J Lipid Res 47:2482–2491 - PubMed

Publication types

MeSH terms