. 2010 Apr;78(4):1495-508.
doi: 10.1128/IAI.00743-09. Epub 2010 Jan 19.

Burkholderia cenocepacia creates an intramacrophage replication niche in zebrafish embryos, followed by bacterial dissemination and establishment of systemic infection

Affiliations

Burkholderia cenocepacia creates an intramacrophage replication niche in zebrafish embryos, followed by bacterial dissemination and establishment of systemic infection

Annette C Vergunst et al. Infect Immun. 2010 Apr.

Abstract

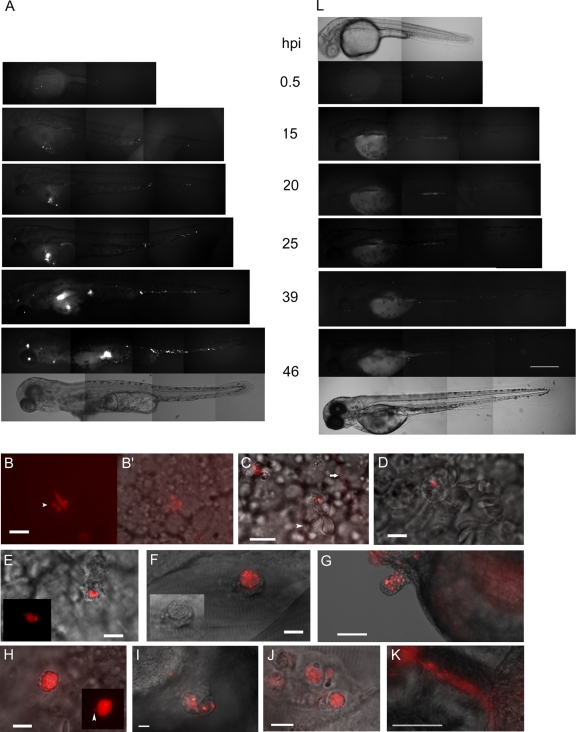
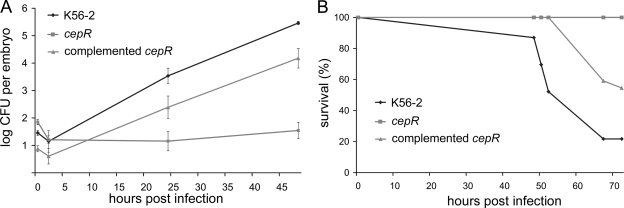
Bacteria belonging to the "Burkholderia cepacia complex" (Bcc) often cause fatal pulmonary infections in cystic fibrosis patients, yet little is know about the underlying molecular mechanisms. These Gram-negative bacteria can adopt an intracellular lifestyle, although their ability to replicate intracellularly has been difficult to demonstrate. Here we show that Bcc bacteria survive and multiply in macrophages of zebrafish embryos. Local dissemination by nonlytic release from infected cells was followed by bacteremia and extracellular replication. Burkholderia cenocepacia isolates belonging to the epidemic electrophoretic type 12 (ET12) lineage were highly virulent for the embryos; intravenous injection of <10 bacteria of strain K56-2 killed embryos within 3 days. However, small but significant differences between the clonal ET12 isolates K56-2, J2315, and BC7 were evident. In addition, the innate immune response in young embryos was sufficiently developed to control infection with other less virulent Bcc strains, such as Burkholderia vietnamiensis FC441 and Burkholderia stabilis LMG14294. A K56-2 cepR quorum-sensing regulator mutant was highly attenuated, and its ability to replicate and spread to neighboring cells was greatly reduced. Our data indicate that the zebrafish embryo is an excellent vertebrate model to dissect the molecular basis of intracellular replication and the early innate immune responses in this intricate host-pathogen interaction.


Figures

FIG. 1.
FIG. 1.
B. cenocepacia ET12 lineage strains, but not J415, are highly virulent for zebrafish embryos. (A) Drawing of zebrafish embryo 30 hpf. The site of microinjection in the blood island is indicated. Scale bar, 100 μm. (B) Bacterial multiplication in embryos microinjected with K56-2 and J2315. The data are geometric means ± standard errors of the means (n = 5). The mean sizes of the inoculum for each embryo were 143 CFU (K56-2) and 4 CFU (K56-2 LD) for K56-2 and 117 CFU for J2315. J2315 and K56-2 differed significantly from each other in growth kinetics at 24 and 48 hpi (P = 0.0081 and P = 0.0067, Student's t test). The standard errors of the means at 24 hpi and 48 hpi were reproducibly less for K56-2 than for J2315 (for K56-2, 4.06 ± 0.03 and 5.54 ± 0.13 log CFU; for J2315, 2.94 ± 0.32 and 4.20 ± 0.27 log CFU). (C and D) Results of experiments in which embryos were inoculated with B. cenocepacia strains BC7 (45 CFU), J415 (72 CFU), J2315 (60 CFU), and K56-2 (126 CFU). (C) Survival following injection of different strains (n = 20 for each strain). (D) Bacterial multiplication within embryos. The data are geometric means ± standard errors of the means (n = 5). In this experiment the results for BC7 differed significantly from the results for K56-2 and J415 at 24 hpi (P = 0.00076 and P = 0.0051, respectively) and at 48 hpi (P = 0.008 and P = 1.5 × 10⁻⁵, respectively), and the results for J2315 and K56-2 differed significantly at 48 hpi (P = 0.003) but not at 24 hpi (P = 0.14). (E and F) Fluorescent images of embryos microinjected with K56-2 (E) and J2315 (F) expressing DSRed at 46 hpi and 68 hpi, respectively. The images show the final stages of infection. The arrowhead and arrow in panel F indicate bacterial aggregate formation in the intersegmental vessels in the tail. Scale bar, 300 μm.
FIG. 2.
FIG. 2.
Different Bcc strains show distinct levels of virulence in zebrafish embryos, reflecting clinical information. Embryos were microinjected with B. cenocepacia K56-2 (134 CFU), B. cepacia CEP509 (114 CFU), B. stabilis LMG14294 (62 CFU), and B. vietnamiensis FC441 (234 CFU). One subgroup was used to determine bacterial multiplication, and another subgroup was used to determine mortality rates. (A) Bacterial multiplication within embryos. The data are geometric means ± standard errors of the means (n = 5). The bacterial loads of K56-2 at 24 hpi and 48 hpi were significantly greater than those of CEP509 (P = 0.002 and P = 0.09), LMG14294 (P = 0.001 and P = 0.005), and FC441 (P = 1.0 × 10⁻⁵ and 1.5 × 10⁻⁶). CEP509 was significantly more virulent than LMG14294 and FC441 at 24 hpi (P = 0.01 and 0.0002, respectively) and at 48 hpi (P = 0.002 and 8.3 × 10⁻⁵, respectively). (B) Embryo survival following infection with Bcc strains (n = 20 for each strain).
FIG. 3.
FIG. 3.
K56-2 survives in zebrafish embryos and starts to replicate between 6 and 8 hpi. Embryos were microinjected with B. cenocepacia K56-2 (61 CFU in experiment 1 [exp1] and 25 CFU in experiment 2 [exp2]). The data are geometric means ± standard errors of the means (n = 5).
FIG. 4.
FIG. 4.
Real-time visualization of K56-2 infection showing intracellular replication, dissemination, and bacteremia. (A and C to L) Real-time analysis by fluorescence microscopy of embryos infected with K56-2 (A and C to K) and a cepR mutant (L) expressing DSRed. (A and L) Fluorescence images taken at 30 min to 46 hpi of two embryos (lateral view, anterior side to the left) infected with ∼175 CFU of K56-2 (A) or ∼130 CFU of cepR (L). For 0.5 hpi and 46 hpi corresponding bright-field images are included. The embryo infected with K56-2 was dead at 46 hpi. Scale bar, 300 μm. (B and B′) Fluorescence image (B) and fluorescence and bright-field overlay image (B′) of an embryo inoculated with 500 CFU E. coli, at 2 hpi. A macrophage in the yolk sac valley containing bacteria is shown. Three vacuoles with degraded E. coli are distinguished by the diffuse red signal and the round small vacuole, in contrast to the large E. coli bacteria (the arrowhead indicates one of the three phagolysosomes). Scale bar, 10 μm. (C) Zebrafish embryo inoculated intravenously with ∼500 CFU K56-2: overlay of fluorescence and DIC images showing a phagocytic cell 30 min after infection, anchored to the side of a blood vessel that has a single K56-2 bacterium adhered to it or taken up. Two erythrocytes (arrowhead) are attached to the macrophage. The two red lines (one indicated by a horizontal arrow) are bacteria moving in the blood circulation at the time of image acquisition. In the left corner is an out-of-focus phagocytic cell with engulfed bacteria. Scale bar, 10 μm. (D and E) Embryos were inoculated with 5 to 10 CFU of K56-2. The DIC and fluorescence overlay images obtained at 9 hpi show B. cenocepacia-containing phagocytic cells that initially took up one or two bacteria. The inset in panel E shows the fluorescence image. Scale bars, 10 μm. (F) Fluorescence and DIC overlay image taken at 23 hpi, showing a highly infected cell in the tail region (rostral side to the right, dorsal side up) in which bacteria are clearly present in a membrane-bound vacuole. Scale bar, 10 μm. The inset shows a DIC image. (G) Fluorescence and bright-field overlay image of an infected embryo (rostral side to the right, dorsal side up) at 26 hpi, showing budding of infected cells near the pericardium. Scale bar, 100 μm. (H) Representative DIC and fluorescence overlay image after embryos were inoculated with 5 to 10 CFU of K56-2, showing a cell at 24 hpi that is packed with bacteria and a single bacterium apparently “escaping” from the vacuole. The inset shows the fluorescence image. Scale bar, 10 μm. (I) DIC and fluorescence overlay image of a cell aggregate with Burkholderia-containing cells that formed in an embryo infected with 50 CFU K56-2, at 24 hpi. Scale bar, 50 μm. (J) DIC and fluorescence overlay image of a cell aggregate that formed in an embryo inoculated with 5 to 10 CFU of K56-2, at 28 hpi. At this point in infection bacteria had already spread from the initially infected macrophage to neighboring cells in the aggregate. Scale bar, 10 μm. (K) Bright-field and fluorescence overlay image of an intersegmental blood vessel in the tail, showing formation of extracellular bacterial aggregates. Scale bar, 50 μm. (L) Fluorescence and bright-field images of embryos inoculated with cepR mutant R2 (see above).
FIG. 5.
FIG. 5.
B. cenocepacia is taken up mainly by macrophages, and there is minimal phagocytosis by neutrophils. (A to C) Simultaneous microinjection of high doses (∼500 CFU) of E. coli expressing GFP and B. cenocepacia K56-2 expressing DSRed was followed by engulfment of both bacterial species by the same cell type, at 0.5 hpi. (A) Fluorescence image overlay showing overview of colocalization of E. coli (green) and K56-2 (red) in the yolk sac circulation valley, at 0.5 hpi. Scale bar, 50 μm. (B and B′) DIC close-up image of phagocytic cell at 1 hpi (B) and DIC and fluorescence overlay image of the same cell (B′) with E. coli (green) and K56-2 (red) adhering to or engulfed by the cell. Scale bar, 10 μm. (C) Fluorescence image of a phagocytic cell with E. coli (green) and K56-2 (red). Scale bar, 10 μm. (D and E) Colocalization of FISH signal (red) with macrophage-specific riboprobe cfs1R and an immunolabeling signal for B. cenocepacia (green), at 5 hpi. Scale bar, 10 μm. The inset in panel E is an enlarged fluorescence image (green filter). (F and G) FISH using a neutrophil-specific mpx riboprobe (red signal) and an immunolabeling signal for B. cenocepacia (green), at 24 hpi. The images are two images of the same embryo (rostral side to left, dorsal side up) but in different focal planes. (F) The microscope was focused on the B. cenocepacia-containing cells, and mpx-stained cells are not in focus. (G) The microscope was focused on mpx-positive cells, and B. cenocepacia containing cells are not in focus. Scale bar, 100 μm. (H to J). K56-2 (∼500 CFU) infection of Tg(mpx::eGFP)i114 embryos at 30 hpf. (H) From left to right, images of the embryo sac taken with the red channel, the green channel, green and red overlay, and fluorescence-DIC overlay. Cells in the embryo sac valley at 3 hpi that have taken up many DSRed-expressing bacteria do not colocalize with mpx-GFP-expressing neutrophils. Scale bar, 50 μm. (I) Close-up image of individual fluorescence and overlay (combined fluorescence and DIC) images showing mpx-GFP-expressing neutrophils and K56-2 at 3 hpi. The inset is an enlargement of a neutrophil that has taken up a DSRed-expressing bacterium, indicated by an arrowhead. The arrows indicate non-GFP-fluorescing cells containing multiple DSRed-expressing bacteria. Scale bar, 10 μm. (J) Fluorescent overlay images showing six individual GFP-expressing neutrophils, at 18 hpi. About 20 to 30% of the cells with GFP fluorescence contained one or a few bacteria (arrowheads). The arrows indicate nonfluorescent cells containing bacteria. Scale bar, 10 μm.
FIG. 6.
FIG. 6.
K56-2 cepR mutant is highly attenuated in virulence: infection kinetics (A) and survival assay results (B) for wild-type strain K56-2, cepR mutant R2, and the cepR mutant complemented with pSLR100. (A) The average numbers of microinjected bacteria were 39 CFU (K56-2), 77 CFU (cepR), and 8 CFU (cepR mutant complemented with pSLR100). The data are geometric means ± standard errors of the means (n = 5). The growth of the mutant differed significantly from the growth of the wild-type parent at 24 hpi (P = 0.0015) and at 48 hpi (P = 1.3 × 10⁻⁶) and from the growth of the complemented mutant at 48 hpi (P = 0.0007). (B) Embryo survival following infection with Bcc strain K56-2 (31 CFU), strain R2 (83 CFU), and complemented strain R2 (16 CFU) (n = 20 for each strain).

Similar articles

Cited by

References

    1. Bernier, S. P., L. Silo-Suh, D. E. Woods, D. E. Ohman, and P. A. Sokol. 2003. Comparative analysis of plant and animal models for characterization of Burkholderia cepacia virulence. Infect. Immun. 71:5306-5313. - PMC - PubMed
    1. Boshra, H., J. Li, and J. O. Sunyer. 2006. Recent advances on the complement system of teleost fish. Fish Shellfish Immunol. 20:239-262. - PubMed
    1. Brannon, M. K., J. M. Davis, J. R. Mathias, C. J. Hall, J. C. Emerson, P. S. Crosier, A. Huttenlocher, L. Ramakrishnan, and S. M. Moskowitz. 2009. Pseudomonas aeruginosa type III secretion system interacts with phagocytes to modulate systemic infection of zebrafish embryos. Cell. Microbiol. 11:755-768. - PMC - PubMed
    1. Burns, J. L., M. Jonas, E. Y. Chi, D. K. Clark, A. Berger, and A. Griffith. 1996. Invasion of respiratory epithelial cells by Burkholderia (Pseudomonas) cepacia. Infect. Immun. 64:4054-4059. - PMC - PubMed
    1. Bylund, J., L. A. Burgess, P. Cescutti, R. K. Ernst, and D. P. Speert. 2006. Exopolysaccharides from Burkholderia cenocepacia inhibit neutrophil chemotaxis and scavenge reactive oxygen species. J. Biol. Chem. 281:2526-2532. - PubMed

Publication types

LinkOut - more resources