

Bile acid reflux contributes to development of esophageal adenocarcinoma via activation of phosphatidylinositol-specific phospholipase Cgamma2 and NADPH oxidase NOX5-S
- PMID: 20086178
- PMCID: PMC3057572
- DOI: 10.1158/0008-5472.CAN-09-2774
Bile acid reflux contributes to development of esophageal adenocarcinoma via activation of phosphatidylinositol-specific phospholipase Cgamma2 and NADPH oxidase NOX5-S
Abstract
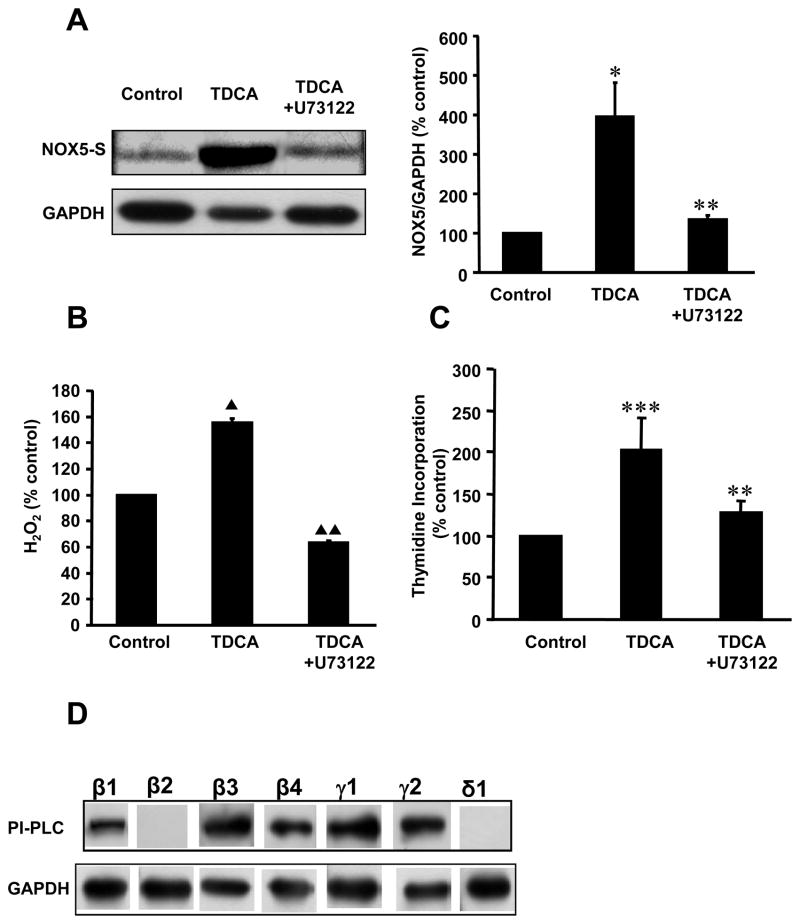
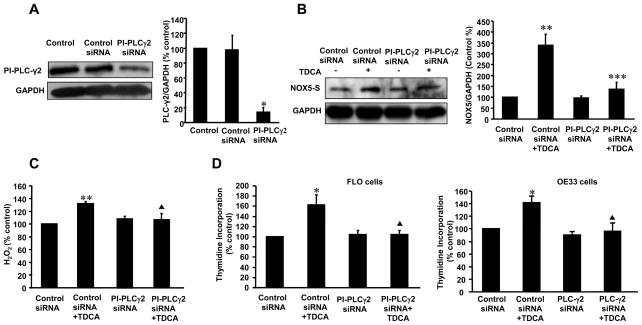
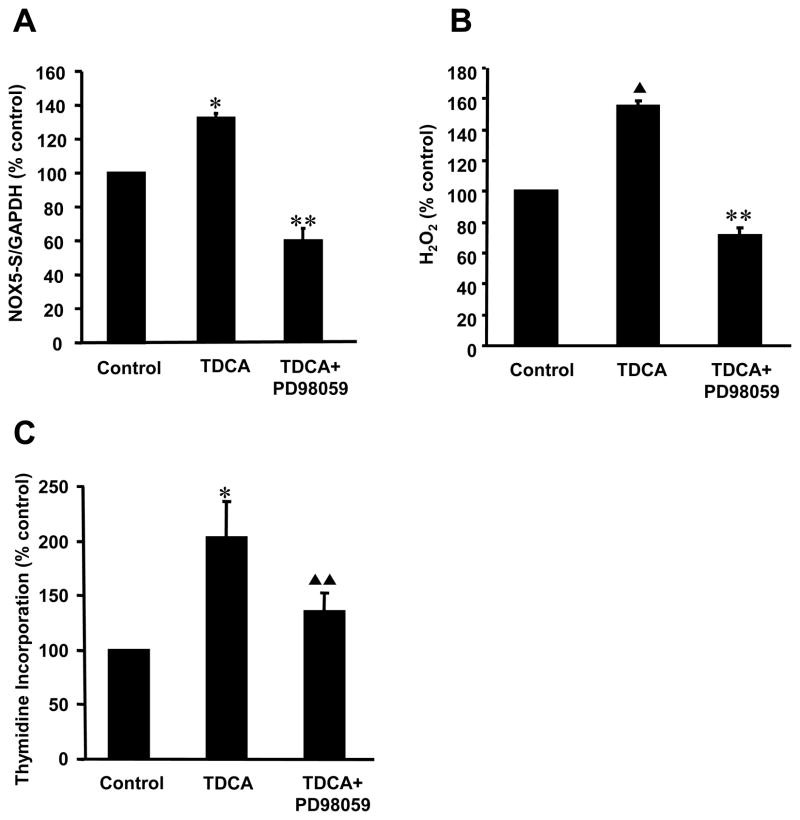
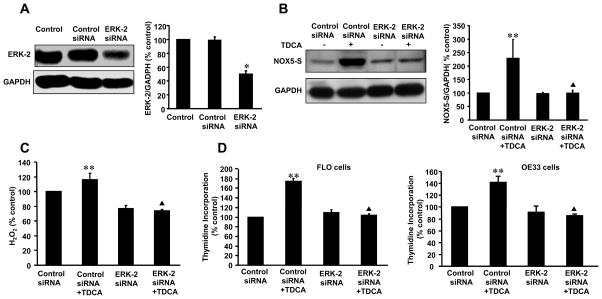
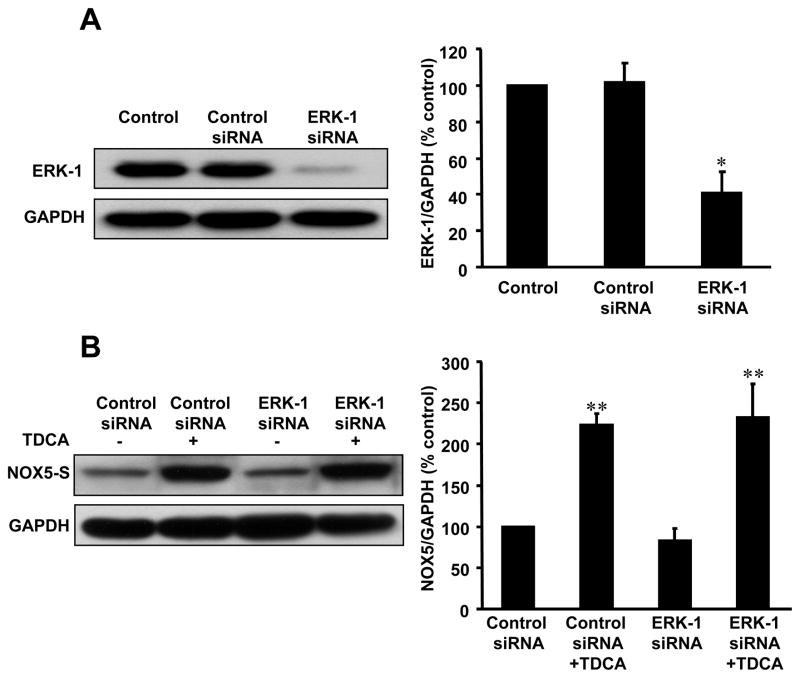
Gastroesophageal reflux disease complicated by Barrett's esophagus (BE) is a major risk factor for esophageal adenocarcinoma (EA). However, the mechanisms of the progression from BE to EA are not fully understood. Besides acid reflux, bile acid reflux may also play an important role in the progression from BE to EA. In this study, we examined the role of phosphatidylinositol-specific phospholipase C (PI-PLC) and a novel NADPH oxidase NOX5-S in bile acid-induced increase in cell proliferation. We found that taurodeoxycholic acid (TDCA) significantly increased NOX5-S expression, hydrogen peroxide (H(2)O(2)) production, and cell proliferation in EA cells. The TDCA-induced increase in cell proliferation was significantly reduced by U73122, an inhibitor of PI-PLC. PI-PLCbeta1, PI-PLCbeta3, PI-PLCbeta4, PI-PLCgamma1, and PI-PLCgamma2, but not PI-PLCbeta2 and PI-PLCdelta1, were detectable in FLO cells by Western blot analysis. Knockdown of PI-PLCgamma2 or extracellular signal-regulated kinase (ERK) 2 mitogen-activated protein (MAP) kinase with small interfering RNAs (siRNA) significantly decreased TDCA-induced NOX5-S expression, H(2)O(2) production, and cell proliferation. In contrast, knockdown of PI-PLCbeta1, PI-PLCbeta3, PI-PLCbeta4, PI-PLCgamma1, or ERK1 MAP kinase had no significant effect. TDCA significantly increased ERK2 phosphorylation, an increase that was reduced by U73122 or PI-PLCgamma2 siRNA. We conclude that TDCA-induced increase in NOX5-S expression and cell proliferation may depend on sequential activation of PI-PLCgamma2 and ERK2 MAP kinase in EA cells. It is possible that bile acid reflux present in patients with BE may increase reactive oxygen species production and cell proliferation via activation of PI-PLCgamma2, ERK2 MAP kinase, and NADPH oxidase NOX5-S, thereby contributing to the development of EA.
Figures

Similar articles
-
Signaling in H2O2-induced increase in cell proliferation in Barrett's esophageal adenocarcinoma cells.J Pharmacol Exp Ther. 2011 Oct;339(1):218-27. doi: 10.1124/jpet.111.182352. Epub 2011 Jul 12. J Pharmacol Exp Ther. 2011. PMID: 21750116 Free PMC article.
-
STAT5 mediates PAF-induced NADPH oxidase NOX5-S expression in Barrett's esophageal adenocarcinoma cells.Am J Physiol Gastrointest Liver Physiol. 2008 Jan;294(1):G174-83. doi: 10.1152/ajpgi.00291.2007. Epub 2007 Oct 18. Am J Physiol Gastrointest Liver Physiol. 2008. PMID: 17947454
-
Role of a novel bile acid receptor TGR5 in the development of oesophageal adenocarcinoma.Gut. 2010 Feb;59(2):170-80. doi: 10.1136/gut.2009.188375. Epub 2009 Nov 18. Gut. 2010. PMID: 19926617 Free PMC article.
-
Overview of major molecular alterations during progression from Barrett's esophagus to esophageal adenocarcinoma.Ann N Y Acad Sci. 2016 Oct;1381(1):74-91. doi: 10.1111/nyas.13134. Epub 2016 Jul 14. Ann N Y Acad Sci. 2016. PMID: 27415609 Review.
-
Nox5 and the regulation of cellular function.Antioxid Redox Signal. 2009 Oct;11(10):2443-52. doi: 10.1089/ars.2009.2587. Antioxid Redox Signal. 2009. PMID: 19331545 Free PMC article. Review.
Cited by
-
Evolution of the ferric reductase domain (FRD) superfamily: modularity, functional diversification, and signature motifs.PLoS One. 2013;8(3):e58126. doi: 10.1371/journal.pone.0058126. Epub 2013 Mar 7. PLoS One. 2013. PMID: 23505460 Free PMC article.
-
Endoscopic assessment and management of early esophageal adenocarcinoma.World J Gastrointest Oncol. 2014 Aug 15;6(8):275-88. doi: 10.4251/wjgo.v6.i8.275. World J Gastrointest Oncol. 2014. PMID: 25132925 Free PMC article. Review.
-
Phospholipase C.Adv Exp Med Biol. 2020;1131:215-242. doi: 10.1007/978-3-030-12457-1_9. Adv Exp Med Biol. 2020. PMID: 31646512 Free PMC article. Review.
-
Elevation of fatty acid desaturase 2 in esophageal adenocarcinoma increases polyunsaturated lipids and may exacerbate bile acid-induced DNA damage.Clin Transl Med. 2022 May;12(5):e810. doi: 10.1002/ctm2.810. Clin Transl Med. 2022. PMID: 35560527 Free PMC article.
-
Cholic Acid Stimulates MMP-9 in Human Colon Cancer Cells via Activation of MAPK, AP-1, and NF-κB Activity.Int J Mol Sci. 2020 May 12;21(10):3420. doi: 10.3390/ijms21103420. Int J Mol Sci. 2020. PMID: 32408577 Free PMC article.
References
-
- Pohl H, Welch HG. The role of overdiagnosis and reclassification in the marked increase of esophageal adenocarcinoma incidence. J Natl Cancer Inst. 2005;97:142–6. - PubMed
-
- Lagergren J, Bergstrom R, Lindgren A, Nyren O. Symptomatic gastroesophageal reflux as a risk factor for esophageal adenocarcinoma. N Engl J Med. 1999;340:825–831. - PubMed
-
- Farhadi A, Fields J, Banan A, Keshavarzian A. Reactive oxygen species: are they involved in the pathogenesis of GERD, Barrett’s esophagus, and the latter’s progression toward esophageal cancer? Am J Gastroenterol. 2002;97:22–6. - PubMed
-
- Sihvo EI, Ruohtula T, Auvinen MI, Koivistoinen A, Harjula AL, Salo JA. Simultaneous progression of oxidative stress and angiogenesis in malignant transformation of Barrett esophagus. J Thorac Cardiovasc Surg. 2003;126:1952–1957. - PubMed
Publication types
MeSH terms
Substances
Grants and funding
LinkOut - more resources
Full Text Sources
Other Literature Sources
Research Materials
Miscellaneous
