. 2010 Jan;22(1):159-72.
doi: 10.1105/tpc.109.069294. Epub 2010 Jan 19.

Loss-of-function mutations of retromer large subunit genes suppress the phenotype of an Arabidopsis zig mutant that lacks Qb-SNARE VTI11

Affiliations

Loss-of-function mutations of retromer large subunit genes suppress the phenotype of an Arabidopsis zig mutant that lacks Qb-SNARE VTI11

Yasuko Hashiguchi et al. Plant Cell. 2010 Jan.

Abstract

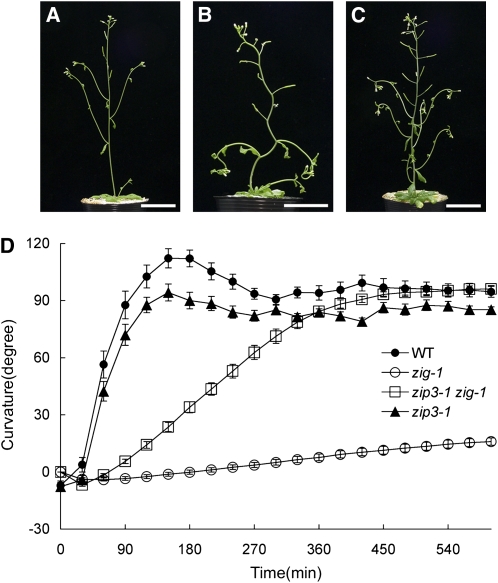
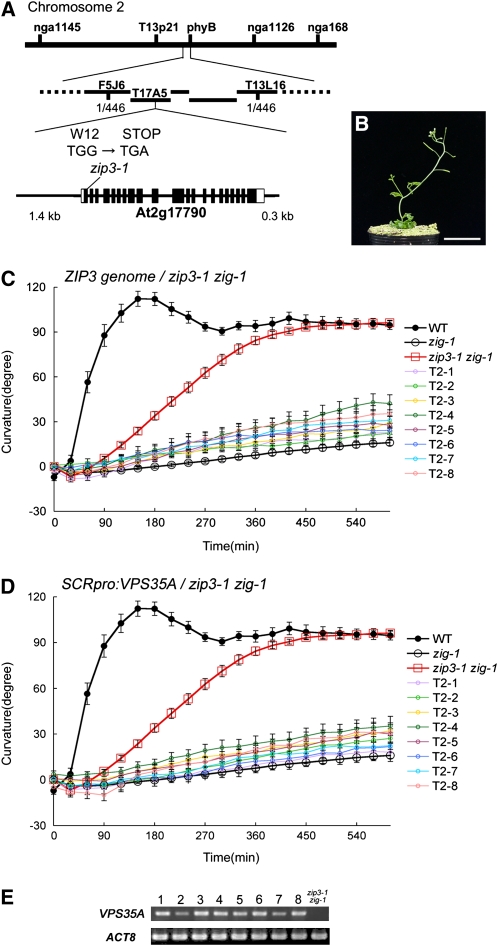
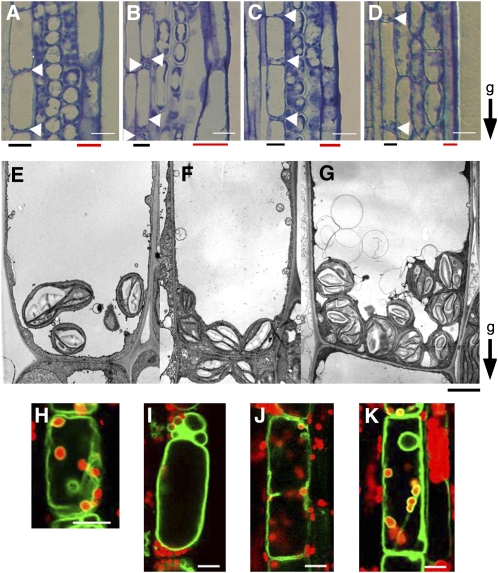
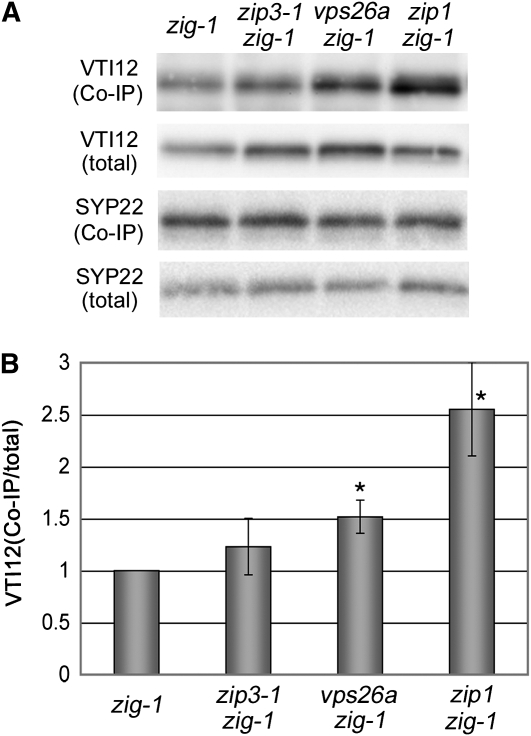
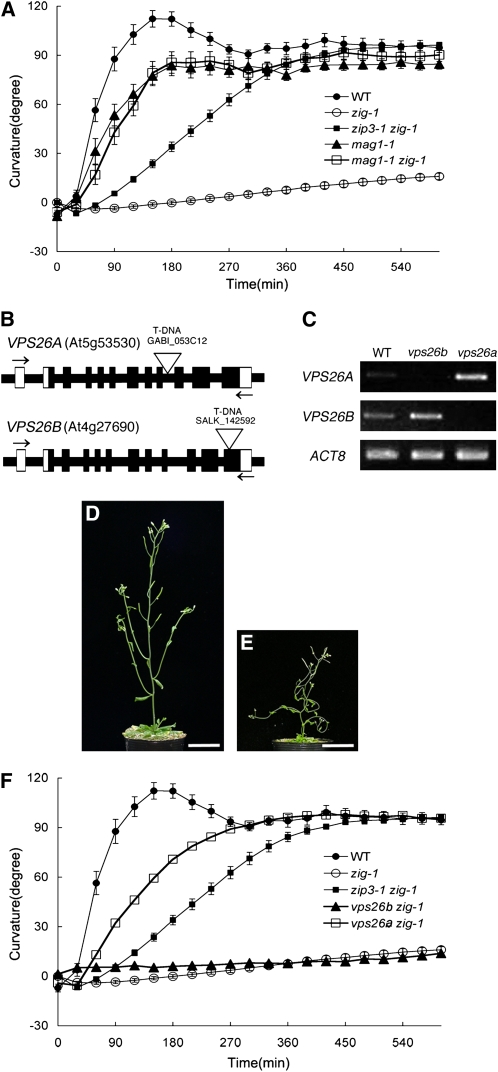
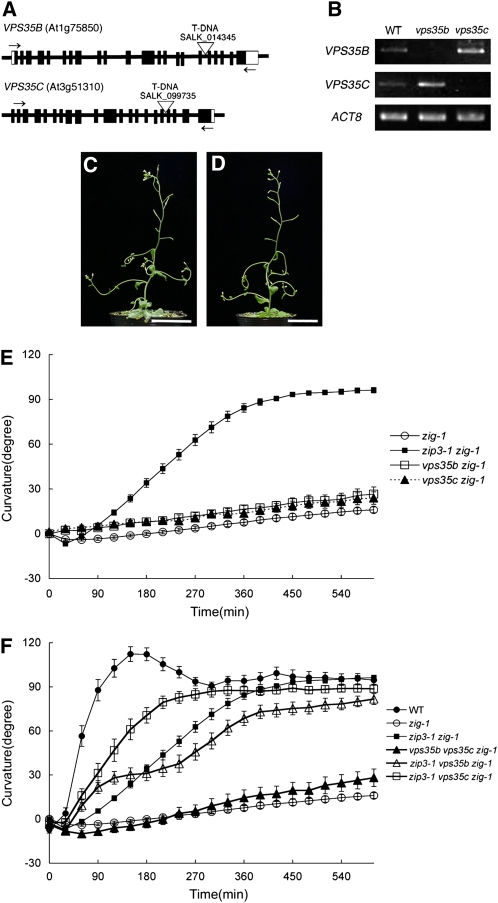
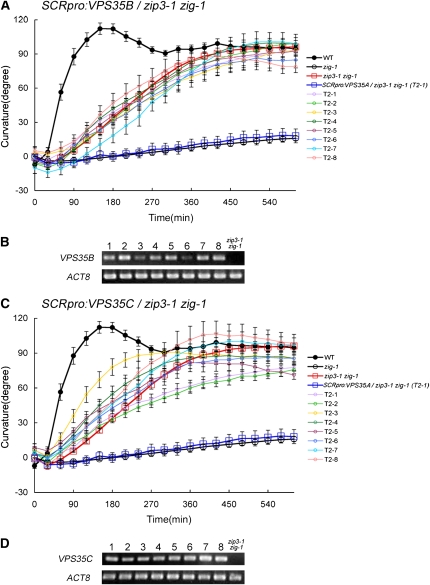
Arabidopsis thaliana zigzag (zig) is a loss-of-function mutant of Qb-SNARE VTI11, which is involved in membrane trafficking between the trans-Golgi network and the vacuole. zig-1 exhibits abnormalities in shoot gravitropism and morphology. Here, we report that loss-of-function mutants of the retromer large subunit partially suppress the zig-1 phenotype. Moreover, we demonstrate that three paralogous VPS35 genes of Arabidopsis have partially overlapping but distinct genetic functions with respect to zig-1 suppression. Tissue-specific complementation experiments using an endodermis-specific SCR promoter show that expression of VPS35B or VPS35C cannot complement the function of VPS35A. The data suggest the existence of functionally specialized paralogous VPS35 genes that nevertheless share common functions.


Figures

Figure 1.
Figure 1.
Phenotypes of the zip3-1 zig-1 Double Mutant. (A) to (C) Six-week-old plants of wild type (A), zig-1 (B), and zip3-1 zig-1 (C). Bars = 3 cm. (D) Gravitropic phenotypes of the wild type (closed circles), zig-1 (open circles), zip3-1 (closed triangles), and zip3-1 zig-1 (open squares). After 5-week-old plants were placed horizontally at 23 ° C under dim nondirectional light, inflorescence curvature was measured at 30-min intervals. Twenty individuals of each genotype were examined. Bars represent se. [See online article for color version of this figure.]
Figure 2.
Figure 2.
ZIP3 Is VPS35A. (A) The ZIP3 locus was mapped between two cleaved-amplified polymorphic sequence markers, F5J6 and T13L16 on chromosome 2. A nonsense mutation was found at the twelfth Trp in the At2g17790 gene in the zip3-1 zig-1 mutant. The gene structure of At2g17790 is shown schematically; exons are indicated by boxes (open boxes, untranslated region; closed boxes, coding regions), and introns are indicated by lines between boxes. (B) and (C) Complementation analysis. (B) Aerial part of 5-week-old zip3-1 zig-1 T2 plant bearing the At2g17790 genomic fragment indicated in (A). Note that it shows a zig-1-like phenotype. Bar = 3 cm. (C) Gravitropic response of wild-type (closed circles), zip3-1 zig-1 (red open squares), zig-1 (open circles), and eight independent T2 lines of zip3-1 zig-1 containing the At2g17790 genomic fragment (T2-1 to T2-8; open colored circles). Ten individuals of each transgenic line were examined. Bars represent se. (D) and (E) Endodermis-specific expression of VPS35A extinguished the suppressive effect of zip3-1 on the zig-1 phenotype. (D) Gravitropic response of wild-type (closed circles), zip3-1 zig-1 (red open squares), zig-1 (open circles), and independent eight T2 lines of zip3-1 zig-1 containing SCRpro:ZIP3/cVPS35A (T2-1 to T2-8; open colored circles). Ten individuals of each transgenic line were examined. Bars represent se. (E) Expression of ZIP3/VPS35A derived from the transgene was confirmed by RT-PCR analyses of the eight transgenic lines. Analysis of the untransformed double mutant line is shown in the lane at the far right.
Figure 3.
Figure 3.
Endodermis of Inflorescence Stems. (A) to (D) Longitudinal sections of inflorescence stems ( ∼ 2 to 3 cm below the apex) of the wild type (A), zig-1 (B), zip3-1 zig-1 (C), and zip3-1 (D). The growth orientation of stems was maintained during fixation. g, direction of gravity; red bars, epidermis; black bars, endodermis. Arrowheads indicate location of amyloplasts in endodermal cells. Bars = 20 μ m. (E) to (G) Electron microscopy of endodermal cell of the wild type (E), zig-1(F), and zip3-1 zig-1 (G). g, direction of gravity. Bars = 2 μ m. (H) to (K) Confocal images of amyloplasts and vacuolar membrane in living endodermal cells. The wild type (H), zig-1 (I), zip3-1 zig-1 (J), and zip3-1 (K). Amyloplasts and vacuolar membranes were observed using chlorophyll autofluorescence from plastids (red) and GFP fluorescence from GFP- γ -TIP (green), respectively. The transgenic line expressing GFP- γ -TIP under the control of the SCR promoter (Saito et al., 2005) was crossed with each mutant. The result of quantitative analysis based on this observation is shown in Supplemental Table 2 online.
Figure 4.
Figure 4.
Interaction between SYP22 and VTI12. (A) Immunoprecipitation analysis using anti-SYP22 antiserum with zig-1, zip3-1 zig-1, vps26a zig-1, and zip1 zig-1 plant extracts. Proteins were extracted from inflorescence stems of 6-week-old plants. VTI12 and SYP22 in immunoprecipitates were detected by immunoblotting using anti-VTI12 antiserum and anti-SYP22 antiserum, respectively (first and third panels from top). The total amounts of VTI12 and SYP22 are also indicated (second and fourth panels from top). (B) The relative incorporation ratio of VTI12 into the SNARE complex containing SYP22 (immunoprecipitated VTI12/ total VTI12) was calculated based on results shown in (A). Average values of four independent experiments are presented with error bars showing sd. Values were normalized to that of zig-1 plants. Quantification of the band intensity was performed with the software Sion Image. The statistical significance against zig-1 control was tested using a Student t test (*P < 0.05).
Figure 5.
Figure 5.
Suppressive Effect of Loss-of-Function Mutations in Components of the Retromer Large Subunit. (A) Gravitropic response of the wild type (closed circles), zip3-1 zig-1 (closed squares), zig-1 (open circles), mag1-1 (closed triangles), and mag1-1 zig-1 (open squares). At least 15 individuals of each genotype were examined. Bars represent se. (B) Schematic structures of VPS26A and VPS26B genes and positions of T-DNA insertions. Boxes indicate exons, and white regions represent untranslated regions. Open triangles show positions of T-DNA insertions. Arrows indicate the position of primers used for RT-PCR analyses in (C). (C) RT-PCR analysis to detect expression of VPS26A or VPS26B in wild-type and mutant plants using the primers indicated by arrows in (B) (D) and (E) Morphological phenotypes of 6-week-old plants of vps26a zig-1 (D) and vps26b zig-1 (E). Bars = 3 cm. (F) Gravitropic response of wild-type (closed circles), zip3-1 zig-1 (closed squares), zig-1 (open circles), vps26a zig-1 (open squares), and vps26b zig-1 (closed triangles). At least 15 individuals of each genotype were examined. Bars represent se. [See online article for color version of this figure.]
Figure 6.
Figure 6.
Suppressive Effect of Loss-of-Function Mutations in VPS35 Paralogs. (A) Schematic structures of VPS35B and VPS35C genes and positions of T-DNA insertions. Boxes indicate exons, and white regions represent untranslated regions. Open triangles show positions of T-DNA insertions. Arrows indicate the position of primers used for RT-PCR analyses to detect expression of VPS35B or VPS35C in (B). (B) RT-PCR analysis to detect expression of VPS35B or VPS35C in wild-type and mutant plants using the primers indicated by arrows in (A). (C) and (D) Morphological phenotypes of 6-week-old plants of vps35b zig-1 (C) and vps35c zig-1 (D). Bars = 3 cm. (E) Gravitropic response of zip3-1 zig-1 (closed squares), zig-1 (open circles), vps35b zig-1 (open squares), and vps35c zig-1 (closed triangles). At least 15 individuals of each genotype were examined. Bars represent se. (F) Gravitropic response of wild-type (closed circles), zip3-1 zig-1 (closed squares), zig-1 (open circles), zip3-1 vps35b zig-1 (open triangles), zip3-1 vps35c zig-1 (open squares), and vps35b vps35c zig-1 (closed triangles). At least 15 individuals of each genotype were examined. Bars represent se. [See online article for color version of this figure.]
Figure 7.
Figure 7.
Endodermis-Specific Expression of VPS35B or VPS35C in zip3-1 zig-1 Cells. (A) and (C) Gravitropic response of wild-type (closed circles), zip3-1 zig-1 (red open squares), zig-1 (open circles), SCRpro:VPS35A/zip3 zig-1 (blue open squares), and eight independent T2 lines of zip3-1 zig-1 plants containing SCRpro:VPS35B (A) or SCRpro:VPS35C (C) (T2-1 to T2-8; open colored circles). Ten individuals of each transgenic line were examined. Bars represent se. (B) and (D) Expression of VPS35B (B) or VPS35C (D) derived from the transgene was confirmed by RT-PCR analyses of the eight transgenic lines in each case.

Similar articles

Cited by

References

    1. Bassham D.C., Sanderfoot A.A., Kovaleva V., Zheng H., Raikhel N.V. (2000). AtVPS45 complex formation at the trans-Golgi network. Mol. Biol. Cell 11: 2251–2265 - PMC - PubMed
    1. Bonifacino J.S., Hurley J.H. (2008). Retromer. Curr. Opin. Cell Biol. 20: 427–436 - PMC - PubMed
    1. Bonifacino J.S., Rojas R. (2006). Retrograde transport from endosomes to the trans-Golgi network. Nat. Rev. Mol. Cell Biol. 7: 568–579 - PubMed
    1. Cai H., Reinisch K., Ferro-Novick S. (2007). Coats, tethers, Rabs, and SNAREs work together to mediate the intracellular destination of a transport vesicle. Dev. Cell 12: 671–682 - PubMed
    1. Canuel M., Lefrancois S., Zeng J., Morales C.R. (2008). AP-1 and retromer play opposite roles in the trafficking of sortilin between the Golgi apparatus and the lysosomes. Biochem. Biophys. Res. Commun. 366: 724–730 - PubMed

Publication types

Substances