. 2010 Apr;59(4):978-86.
doi: 10.2337/db09-0881. Epub 2010 Jan 19.

Involvement of microRNAs in the cytotoxic effects exerted by proinflammatory cytokines on pancreatic beta-cells

Affiliations

Involvement of microRNAs in the cytotoxic effects exerted by proinflammatory cytokines on pancreatic beta-cells

Elodie Roggli et al. Diabetes. 2010 Apr.

Abstract

Objective: Pancreatic beta-cells exposed to proinflammatory cytokines display alterations in gene expression resulting in defective insulin secretion and apoptosis. MicroRNAs are small noncoding RNAs emerging as key regulators of gene expression. Here, we evaluated the contribution of microRNAs to cytokine-mediated beta-cell cytotoxicity.

Research design and methods: We used global microarray profiling and real-time PCR analysis to detect changes in microRNA expression in beta-cells exposed to cytokines and in islets of pre-diabetic NOD mice. We assessed the involvement of the microRNAs affected in cytokine-mediated beta-cell failure by modifying their expression in insulin-secreting MIN6 cells.

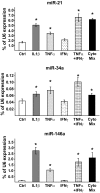
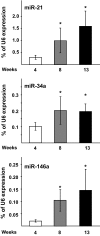
Results: We found that IL-1beta and TNF-alpha induce the expression of miR-21, miR-34a, and miR-146a both in MIN6 cells and human pancreatic islets. We further show an increase of these microRNAs in islets of NOD mice during development of pre-diabetic insulitis. Blocking miR-21, miR-34a, or miR-146a function using antisense molecules did not restore insulin-promoter activity but prevented the reduction in glucose-induced insulin secretion observed upon IL-1beta exposure. Moreover, anti-miR-34a and anti-miR-146a treatment protected MIN6 cells from cytokine-triggered cell death.

Conclusions: Our data identify miR-21, miR-34a, and miR-146a as novel players in beta-cell failure elicited in vitro and in vivo by proinflammatory cytokines, notably during the development of peri-insulitis that precedes overt diabetes in NOD mice.


Figures
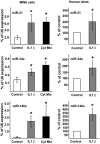
FIG. 1.
FIG. 1.
Effect of IL-1β and of a mix of cytokines on the expression of miR-21, miR-34a, and miR-146a. Left panel: MIN6 cells were incubated for 24 h with 10 ng/ml IL-1β or with a mix of 10 ng/ml IL-1β, 10 ng/ml TNF-α, and 10 ng/ml IFN-γ. The expression of the indicated miRNAs was assessed by quantitative RT-PCR. The results are expressed as percent of the level of U6, which was measured in parallel in the same samples. They are the means ± SEM of three independent experiments. *Conditions that are significantly different from controls (P < 0.05). Right panel: Isolated human pancreatic islets were incubated for 24 h in the presence or absence of 10 ng/ml IL-1β. The expression of the indicated miRNAs was assessed by quantitative RT-PCR and is expressed as percent of the level of the corresponding miRNA in control islets. Data are shown as means ± SEM of four independent experiments. *Conditions significantly different from controls (P < 0.05; n = 4). Cyto, cytokine.
FIG. 2.
FIG. 2.
Effect of different cytokine combinations on the expression of miR-21, miR-34a, and miR-146a. MIN6 cells were incubated in the presence of the indicated cytokines (10 ng/ml) for 24 h. The expression of miR-21 (A), miR-34a (B), and miR-146a (C) was assessed by quantitative RT-PCR. The results are expressed as percent of the level of U6 that was measured in parallel in the same samples. Data are shown as means ± SEM of three independent experiments. *Conditions that are significantly different from controls (P < 0.05). Cyto, cytokine.
FIG. 3.
FIG. 3.
Expression of miR-21, miR-34a, and miR-146a in pancreatic islets of NOD mice. Pancreatic islets were isolated from female NOD mice of different ages. Only animals displaying blood glucose levels within the normal range were included in the study. Blood glucose levels for the mice included in the study were as follows: 99 ± 5 mg/dl for 4-week-old mice (n = 4), 100 ± 8 mg/dl for 8-week-old mice (n = 4), and 132 ± 25 mg/dl for 13-week-old mice (n = 9). The levels of miR-21, miR-34a, and miR-146a were measured by quantitative RT-PCR and are given as % of U6 expression. Data are shown as means ± SEM of four independent experiments. *Conditions that are significantly different from controls (P < 0.05).
FIG. 4.
FIG. 4.
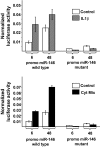
The expression of miR-146a is controlled by the NF-κB pathway. Upper panel: MIN6 cells were transiently cotransfected with a plasmid leading to constitutive expression of Renilla luciferase and with Firefly luciferase reporter constructs driven either by the wild-type miR-146a promoter (promo miR-146 wt) or by a promoter lacking the putative NF-κB binding sites (promo miR-146 mutant). The cells were then treated either for 6 or 48 h with 10 ng/ml IL-1β. The figure shows a representative experiment out of five and presents the ratio between the Firefly and Renilla luciferase activities measured at the end of the IL-1β treatment. Lower panel: The same experiment as in the upper panel, except that the cells were treated with a mixture of cytokines (10 ng/ml IL-1β, 10 ng/ml TNF-α, and 10 ng/ml IFN-γ). Cyt, cytokine.
FIG. 5.
FIG. 5.
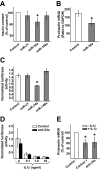
Effect of miR-21, miR-34a, and miR-146a on insulin-promoter activity and insulin biosynthesis. A: MIN6 cells were transfected with a control RNA duplex (open bars) or with duplexes containing the mature forms of miR-21, miR-34a, or miR-146a (gray bars). Insulin content was measured 2 days later by ELISA. The results are expressed as percent of the values in control cells. B: Proinsulin and glyceraldehyde-3-phosphate dehydrogenase (GAPHD) mRNA levels in control MIN6 cells and in cells overexpressing miR-34a were assessed by quantitative RT-PCR. The results are expressed as the ratios between proinsulin and glyceraldehyde-3-phosphate dehydrogenase mRNA. C: MIN6 cells were transiently cotransfected with a Firefly luciferase reporter construct driven by the rat insulin promoter, a plasmid leading to constitutive expression of Renilla luciferase and RNA duplexes containing the indicated mature miRNAs. Luciferase activities were measured 2 days later. The results are expressed as the ratios between Firefly and Renilla luciferases. D: MIN6 cells were transiently cotransfected with a Firefly luciferase reporter construct driven by the rat insulin promoter, a plasmid leading to constitutive expression of Renilla luciferase and with a control antisense oligonucleotide (white bars) or with anti-34a (black bars). The day after, the cells were incubated for 24 h in the presence of the indicated concentrations of IL-1β. The results are expressed as the ratios between Firefly and Renilla luciferases. E: MIN6 cells were transfected with a control oligonucleotide or with anti-34a. The day after, the cells were incubated for 24 h in the presence (gray bars) or absence (white bars) of 10 ng/ml IL-1β. Proinsulin mRNA levels were determined by quantitative RT-PCR. The results are expressed as percent of the level of proinsulin mRNA in untreated control cells. All data are shown as means ± SEM of three (B and E), four (C and D), or eight (A) independent experiments. *Conditions that are significantly different from controls (P < 0.05).
FIG. 6.
FIG. 6.
Involvement of miR-21, miR-34a, and miR-146a in insulin secretion. A: MIN6 cells were transiently transfected with RNA duplexes containing the mature sequence of the indicated miRNAs. Control cells were transfected with a siRNA duplex against green fluorescent protein. Two days later, the cells were preincubated for 30 min in Krebs-Ringer buffer containing 2 mmol/l glucose and successively incubated either in the same buffer (white bars) or in Krebs-Ringer buffer containing 20 mmol/l glucose (gray bars). The amount of insulin released during the incubation period was measured by ELISA. The results are the means ± SEM of three independent experiments. *Significantly different (P < 0.05) from control. B: MIN6 cells were transiently transfected with RNA duplexes leading to the overexpression of miR-21 or miR-34a. The expression of the indicated components of the machinery governing insulin exocytosis was analyzed by Western blotting (left panels). MIN6 cells were transiently transfected with a control oligonucleotide (control) or with O-methyl antisense oligonucleotides blocking the activity of miR-21 or miR-34a (anti-21 and anti-34a, respectively). The day after, the cells were incubated with or without IL-1β for 24 h. The expression of the indicated proteins was analyzed by Western blotting (right panel). The figure shows the results of a representative experiment out of three. C: MIN6 cells were transfected with the indicated anti-miRs. The day after, they were incubated for 24 h with (+) or without (−) IL-1β (1 ng/ml). Insulin release in the presence of 2 and 20 mmol/l glucose was assessed by ELISA. The results are the means ± SEM of five independent experiments. *High glucose conditions that are significantly different from control cells incubated in the presence of IL-1β (P < 0.05).
FIG. 7.
FIG. 7.
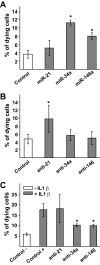
Effect of miR-21, miR-34a, and miR-146a on apoptosis. A: MIN6 cells were transfected with a control RNA duplex (open bars) or with RNA duplexes, leading to a rise of the indicated miRNAs (gray bars). The fraction of dying cells was determined 3 days later by scoring the cells displaying picnotic nuclei. B: MIN6 cells were transfected with a control oligonucleotide (open bars) or with O-methyl antisense oligonucleotides blocking the activity of miR-21, miR-34a, or miR-146a (gray bars). Apoptotic cells were scored 3 days later as described above. C: MIN6 cells transfected with a control oligonucleotide (open bars) or with anti-miRs (gray bars). Two days later, the cells were incubated for 24 h with (gray bars) or without (white bars) 10 ng/ml IL-1β. Dying cells were scored as described above. Data are shown as means ± SEM of six (A) or four (B) and independent (C) experiments. *Conditions that are significantly different from controls (P < 0.05).
FIG. 8.
FIG. 8.
Impact of miR-146a levels on c-Jun expression. A: MIN6 cells were transfected with either control oligonucleotides or oligonucleotides leading to silencing (anti-146a) or overexpression (miR-146a) of miR-146a. Two days later, some of the cells were treated with 10 ng/ml IL-1β for 1 h. The total amount of c-Jun present in the cells at the end of the treatment (c-Jun) and the fraction of the transcription factor in phosphorylated form (c-Jun-p) were assessed by Western blotting. Equal loading in each lane was verified using an antibody against tubulin. B: MIN6 cells were transfected with either control oligonucleotides or with anti-146a. Two days later, the cells were incubated in the presence (+) or absence (−) of 10 ng/ml IL-1β for 1 h. Total c-Jun and phosphorylated c-Jun were detected as above. In this case, the exposure of the film was reduced to prevent its saturation in the lanes containing the samples treated with IL-1β. The figure shows a representative experiment out of three. C: Quantification of the expression of c-Jun and c-Jun-p by densitometric scanning of the films. Data are shown as means ± SEM of three independent experiments. *Conditions that are significantly different from controls (P < 0.05).

Similar articles

Cited by

References

    1. Eizirik DL, Colli ML, Ortis F: The role of inflammation in insulitis and beta-cell loss in type 1 diabetes. Nat Rev Endocrinol 2009; 5: 219– 226 - PubMed
    1. Prentki M, Vischer S, Glennon MC, Regazzi R, Deeney JT, Corkey BE: Malonyl-CoA and long chain acyl-CoA esters as metabolic coupling factors in nutrient-induced insulin secretion. J Biol Chem 1992; 267: 5802– 5810 - PubMed
    1. Donath MY, Storling J, Berchtold LA, Billestrup N, Mandrup-Poulsen T: Cytokines and beta-cell biology: from concept to clinical translation. Endocr Rev 2008; 29: 334– 350 - PubMed
    1. McDaniel ML, Kwon G, Hill JR, Marshall CA, Corbett JA: Cytokines and nitric oxide in islet inflammation and diabetes. Proc Soc Exp Biol Med 1996; 211: 24– 32 - PubMed
    1. Pipeleers D, Hoorens A, Marichal-Pipeleers M, Van de Casteele M, Bouwens L, Ling Z: Role of pancreatic β-cells in the process of β-cell death. Diabetes 2001; 50( Suppl. 1): S52– S57 - PubMed

Publication types

MeSH terms