. 2010 Mar;20(3):393-402.
doi: 10.1101/gr.100545.109. Epub 2010 Jan 19.

Population differentiation as a test for selective sweeps

Affiliations

Population differentiation as a test for selective sweeps

Hua Chen et al. Genome Res. 2010 Mar.

Abstract

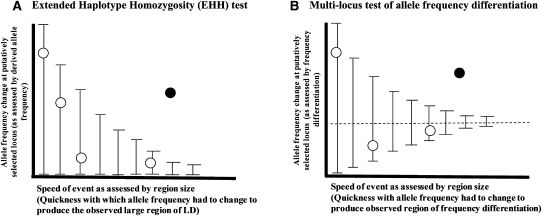
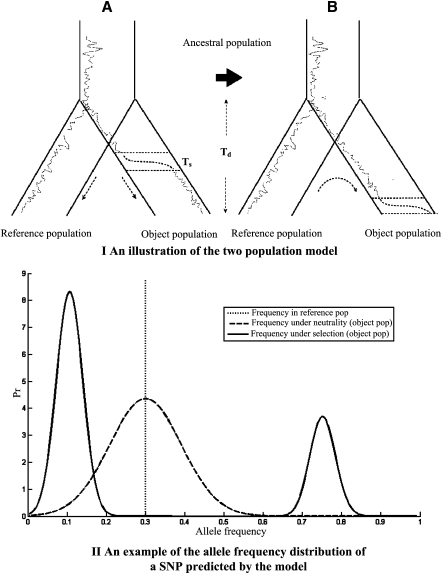
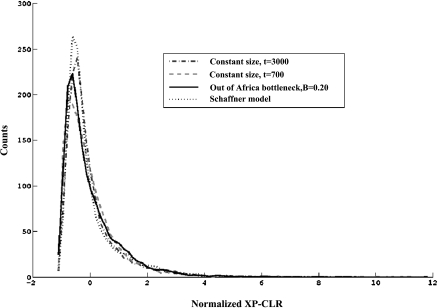
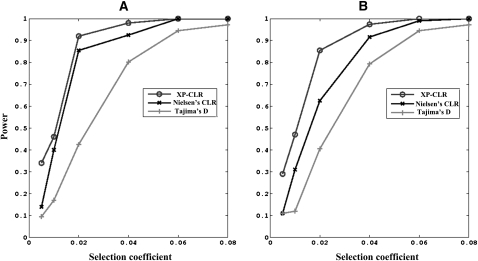
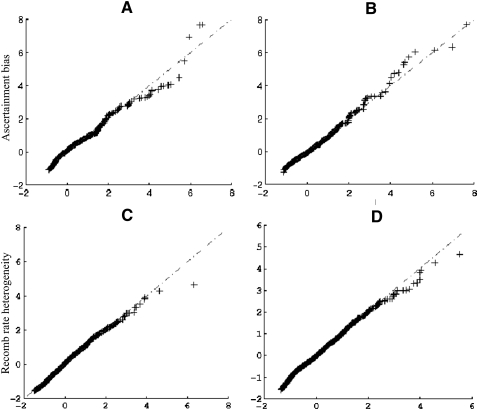
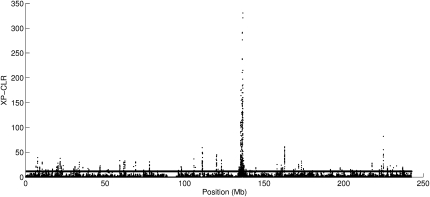
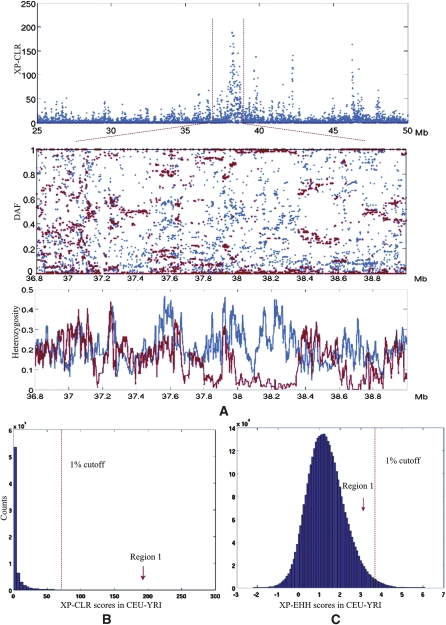
Selective sweeps can increase genetic differentiation among populations and cause allele frequency spectra to depart from the expectation under neutrality. We present a likelihood method for detecting selective sweeps that involves jointly modeling the multilocus allele frequency differentiation between two populations. We use Brownian motion to model genetic drift under neutrality, and a deterministic model to approximate the effect of a selective sweep on single nucleotide polymorphisms (SNPs) in the vicinity. We test the method with extensive simulated data, and demonstrate that in some scenarios the method provides higher power than previously reported approaches to detect selective sweeps, and can provide surprisingly good localization of the position of a selected allele. A strength of our technique is that it uses allele frequency differentiation between populations, which is much more robust to ascertainment bias in SNP discovery than methods based on the allele frequency spectrum. We apply this method to compare continentally diverse populations, as well as Northern and Southern Europeans. Our analysis identifies a list of loci as candidate targets of selection, including well-known selected loci and new regions that have not been highlighted by previous scans for selection.


Figures

Figure 1.
Figure 1.
An analogy between the extended haplotype homozygosity (EHH) test and a multimarker test of unusual allele frequency differentiation. (A) In the EHH test, one searches for sites where the change in allele frequency since a putative selection event began (as assessed by its derived allele frequency) occurred too quickly (as assessed by the extent of LD around the tested allele) due to random genetic drift. The open circles show the expectation under neutrality, while the filled circles shows a selection signal (adapted from Fig. 3 of Sabeti et al. 2002). (B) In the multilocus test of allele frequency differentiation (XP-CLR) the idea is to search for regions in the genome where the change in allele frequency at the locus occurred too quickly (as assessed by the size of the affected region) due to random drift. A large region with moderate differentiation can easily stand out as genome-wide significant (filled circle).
Figure 2.
Figure 2.
(Top panel) Illustration of the two-population model. (A) The two populations split at divergence time Td. The dotted lines represent the historical frequencies of an allele in the two populations; the dashed lines represent the increase of its allele frequency during the selection phase due to hitchhiking with a nearby advantageous allele. (B) Illustration of the modeling procedure. Starting from the observed allele frequency of a SNP in the reference population, the model predicts the allele frequency distributions under neutrality or selection in the object population. (Bottom panel) An example of the allele frequency distribution of a SNP near a putatively selected allele in the object population under selection (Equation 4, solid line) and neutrality (Equation 1, dashed line). The vertical dotted line represents the allele frequency of the SNP in the reference population (p2 = 0.3). The ratio r/s of genetic distance between the SNP and the advantage allele mutant divided by selection intensity is 0.05. The two populations are both assumed to have effective sizes 10,000. The divergence time ω is set to be 0.04.
Figure 3.
Figure 3.
The empirical distributions of XP-CLR scores normalized by their means and variances under a variety of demographic scenarios, showing the robustness to demographic histories.
Figure 4.
Figure 4.
The proportions of significant results for three tests of selection, as assessed by simulations for recent sweeps (A) and ancient sweeps (B). (XP-CLR) the method developed in this study; (Tajima D) Tajima's D test on the data from the object population; (Nielsen CLR) the method developed by Nielsen et al. (2005). Simulations were carried out with constant population sizes of 10,000 and population divergence time of 3000 generations with the code p2S (detailed in Methods). The false-positive rate is chosen to be 0.01. “Ancient” refers to the scenarios in which selection stops at 1000 generations ago; “recent” refers to selection stopping at the current generation.
Figure 5.
Figure 5.
(A,B) A comparison of XP-CLR scores calculated from simulations of an ascertainment bias scheme in which SNPs are discovered in a pilot sample that included two chromosomes from each population. (A) Constant population size model with divergence time of T = 700 generations ago. (B) Constant population size model with divergence time of T = 3000 generations ago. Note that the XP-CLR scores in the figures were normalized. (C,D) A comparison of XP-CLR scores calculated from simulations of models assuming constant recombination rates with those including recombination hotspots or misspecified recombination rates. (C) The recombination hotspot model. (D) Estimated recombination rate is one-fourth of the true recombination rates. XP-CLR scores were normalized before this analysis.
Figure 6.
Figure 6.
Plot of XP-CLR scores along chromosome 2 in a Northern–Southern European population comparison. The horizontal line indicates a 1% genome-wide cutoff level.
Figure 7.
Figure 7.
(A, top) The plot of XP-CLR scores along chromosome 11 from the CEU-YRI comparison. (Middle) The derived allele frequencies of SNPs in YRI (blue dots) and CEU (red dots) populations in the zoomed region. (Bottom) Heterozygosity in the same region. (blue line) The average heterozygosity of 20 SNPs in the YRI population; (red line) CEU. (B,C) Histograms of genome-wide XP-CLR scores (B) and XP-EHH scores (C) in the comparison of CEU-YRI populations. The red arrows indicate the ranks of XP-CLR and XP-EHH scores relative to the genome-wide average.

Similar articles

Cited by

References

    1. Akey JM. Constructing genomic maps of positive selection in humans: Where do we go from here? Genome Res. 2009;19:711–722. - PMC - PubMed
    1. Akey JM, Zhang G, Zhang K, Jin L, Shriver MD. Interrogating a high-density SNP map for signatures of natural selection. Genome Res. 2002;12:1805–1814. - PMC - PubMed
    1. Ashburner M, Ball CA, Blake JA, Botstein D, Butler H, Cherry JM, Davis AP, Dolinski K, Dwight SS, Eppig JT, et al. Gene Ontology: Tool for the unification of biology. The Gene Ontology Consortium. Nat Genet. 2000;25:25–29. - PMC - PubMed
    1. Benjamini Y, Hochberg Y. Controlling the false discovery rate: A practical and powerful approach to multiple testing. J R Stat Soc Ser B Methodol. 1995;57:289–300.
    1. Carlson CS, Thomas DJ, Eberle MA, Swanson JE, Livingston RJ, Rieder MJ, Nickerson DA. Genomic regions exhibiting positive selection identified from dense genotype data. Genome Res. 2005;15:1553–1565. - PMC - PubMed

Publication types

LinkOut - more resources