

Endothelial cell-specific chemotaxis receptor (ecscr) promotes angioblast migration during vasculogenesis and enhances VEGF receptor sensitivity
- PMID: 20086248
- PMCID: PMC2881497
- DOI: 10.1182/blood-2009-10-248856
Endothelial cell-specific chemotaxis receptor (ecscr) promotes angioblast migration during vasculogenesis and enhances VEGF receptor sensitivity
Abstract
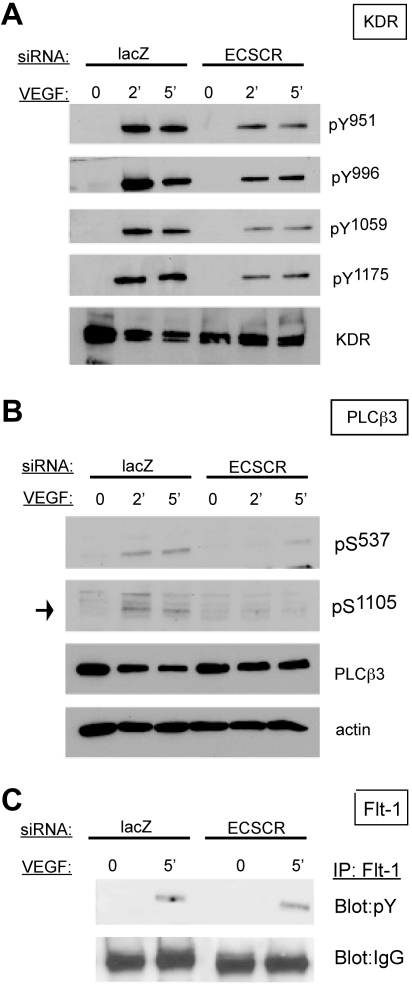
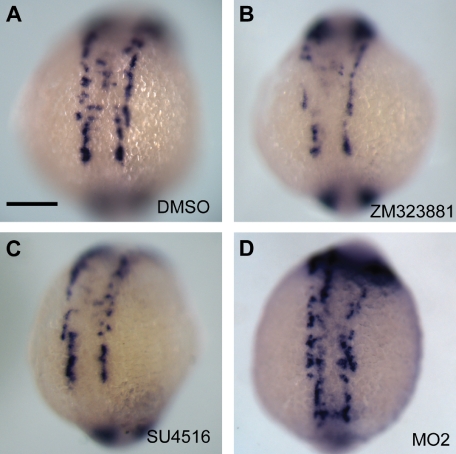
Endothelial cell-specific chemotaxis receptor (ECSCR) is a cell surface protein expressed by blood endothelial cells with roles in endothelial cell migration and signal transduction. We investigated the function of ecscr in the development of the zebrafish vasculature. Zebrafish ecscr is expressed in angioblasts and in axial vessels during angioblast migration and vasculogenesis. Morpholino-directed ecscr knockdown resulted in defective angioblast migration in the posterior lateral plate mesoderm, a process known to depend on vascular endothelial-derived growth factor (VEGF). In cultured cells, transfected ECSCR localized to actin-rich membrane protrusions, colocalizing with kinase insert domain protein receptor (KDR)/VEGF receptor 2 in these regions. ECSCR-silenced cells show reduced VEGF-induced phosphorylation of KDR but not of FMS-like tyrosine kinase 1 (FLT1)/VEGF receptor 1. Finally, chemical inhibition of VEGF receptor activity in zebrafish resulted in angioblast deficiencies that partially overlap with those seen in ecscr morphants. We propose that ecscr promotes migration of zebrafish angioblasts by enhancing endothelial kdr sensitivity to VEGF.
Figures
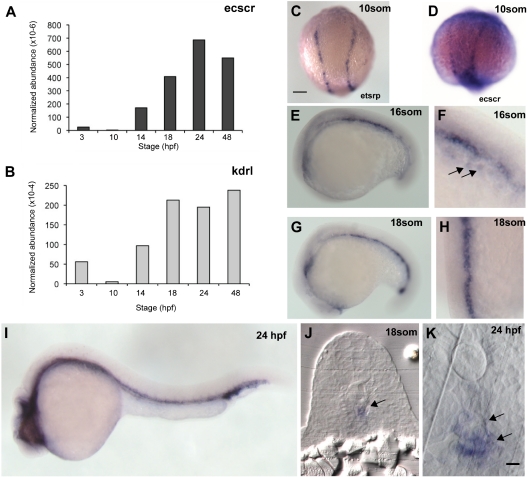
 ). (G) Lateral view at 18 som. (H) Dorsal view at 18 som. Hybridization is detected at the midline vascular cord. (I) Lateral view at 24 hpf. (J-K) Methacrylate sections of whole-mount in situs showing ecscr transcripts localized to midline vascular structures. (J) 18 som. (K) Higher magnification view of a 24-hpf section. point to DA and PCV. Scale bar represents 10 μm.
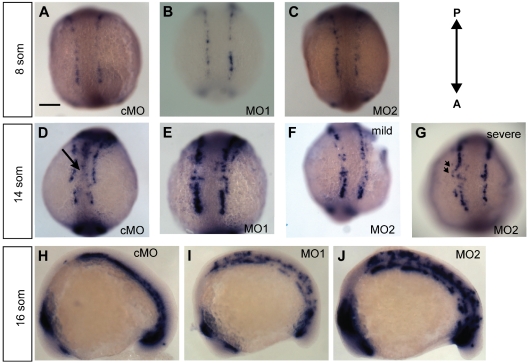 ) and convergence of the premigratory rows toward the midline, whereas anti-ecscr morphants show a greater gap between angioblast rows and few midline angioblasts. MO2 morphants showed a greater range of morpholino phenotypes, with more severely affected morphants (G) showing an irregular row of angioblasts with occasional angioblasts positioned away from the midline (
 in panel G). (H-J) Lateral view of 16-som embryos. cMO-injected embryos and the bulk of MO1- and MO2-injected embryos show a consolidated midline vascular cord (H), whereas approximately 20% of MO1 and MO2 morphants (I-J) show increased numbers of premigratory angioblasts lateral and dorsal to the consolidating vascular cord. Results at each embryonic stage are representative of at least 20 embryos from 2 independent injections.
Comment in
-
EC-specific chemotaxis receptor: a double-edged sword.Blood. 2010 Jun 3;115(22):4328-9. doi: 10.1182/blood-2010-02-268748. Blood. 2010. PMID: 20522720 No abstract available.
References
-
- Jin SW, Beis D, Mitchell T, Chen JN, Stainier DY. Cellular and molecular analyses of vascular tube and lumen formation in zebrafish. Development. 2005;132(23):5199–5209. - PubMed
-
- Ferguson JE, III, Kelley RW, Patterson C. Mechanisms of endothelial differentiation in embryonic vasculogenesis. Arterioscler Thromb Vasc Biol. 2005;25(11):2246–2254. - PubMed
-
- Swift MR, Weinstein BM. Arterial-venous specification during development. Circ Res. 2009;104(5):576–588. - PubMed
Publication types
MeSH terms
Substances
Grants and funding
LinkOut - more resources
Full Text Sources
Molecular Biology Databases
Miscellaneous
