. 2010 May 6;115(18):3801-9.
doi: 10.1182/blood-2009-08-239558. Epub 2010 Jan 19.

Anucleate platelets generate progeny

Affiliations

Anucleate platelets generate progeny

Hansjörg Schwertz et al. Blood. .

Abstract

Platelets are classified as terminally differentiated cells that are incapable of cellular division. However, we observe that anucleate human platelets, either maintained in suspension culture or captured in microdrops, give rise to new cell bodies packed with respiring mitochondria and alpha-granules. Platelet progeny formation also occurs in whole blood cultures. Newly formed platelets are structurally indistinguishable from normal platelets, are able to adhere and spread on extracellular matrix, and display normal signal-dependent expression of surface P-selectin and annexin V. Platelet progeny formation is accompanied by increases in biomass, cellular protein levels, and protein synthesis in expanding populations. Platelet numbers also increase during ex vivo storage. These observations indicate that platelets have a previously unrecognized capacity for producing functional progeny, which involves a form of cell division that does not require a nucleus. Because this new function of platelets occurs outside of the bone marrow milieu, it raises the possibility that thrombopoiesis continues in the bloodstream.


Figures
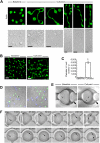
Figure 1
Figure 1
Freshly isolated platelets extend projections with distinct cell bodies. (A) Localization of actin (green, phalloidin) in human platelets that were fixed immediately after isolation (Baseline) or after 6 hours in suspension (Cultured). The bottom row displays corresponding transmission images. This figure is representative of more than 20 independent experiments. Scale bars represent 5 μm. (B) Lower magnification of freshly isolated platelets that were stained for actin at baseline or after they were cultured for 6 hours (scale bars, 10 μm). Panel is representative of more than 20 experiments. (C) The bar graph indicates the number of extended platelets with at least 2 cell bodies per microliter of culture media (mean ± SEM; n = 13). *P < .05, baseline versus cultured. (D) Two separate cultures of platelets were labeled (blue or green) and then incubated with one another for 6 hours. Left and right panels: 2 independent experiments, which are representative of 3. (E) Platelets were loaded into “parked” microdrops and examined at baseline or after 6 hours (Cultured). The thin arrows point to single platelets (Baseline) or the same platelet that formed 2 distinct cell bodies after 6 hours (Cultured). The thick arrows point to unique landmarks for each position in the microfluidic device. (F) Sequential images of platelets using low-resolution wide-field microscopy. The arrows highlight the location of the platelets within each drop during the course of the experiment and the formation of 2 distinct cell bodies after 6 hours (far right panels). Distance between the white brackets (E-F, far left panels) is 50 μm.
Figure 2
Figure 2
Platelets develop new cell bodies in whole blood and express critical biomarkers. (A) Platelets were isolated from freshly collected (Baseline) or cultured (6 hours) whole blood as described in “Platelet isolation and culture.” The red and green stains identify sialic acids (WGA) and β-tubulin, respectively. (B) Freshly isolated platelets were cultured (6 hours) alone or in the presence (far right panels) of thrombin (0.01 U/mL). From left to right in the top row, the red stain identifies αIIbβ3, P-selectin, β-tubulin, control IgG, respiring mitochondria (Mitotracker), or sialic acids. Corresponding transmission images are shown in the bottom row. Scale bars represent 5 μm. Panels A and B are representative of 3 independent experiments.
Figure 3
Figure 3
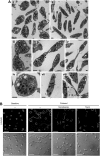
Newly formed platelets possess granules and an elaborate microtubule network. (A) Thin section TEMs of representative platelets at baseline (i,vi,vii) and after 6 hours in culture (ii-v,viii). The black scale bar represents 500 nm. Multiple α granules (black arrows) are observed in platelets with multiple cell bodies (iii-v) and occasionally in the connecting region (iii). A constricted region resembling a cleavage furrow is noted along the long shaft of a cultured platelet (v with inset, original magnification ×80 000; scale bar represents 100 nm). Original magnifications: iii, ×25 000; iv-v, ×30 000. Microtubules in cross section were also observed at ends of the cultured platelets (viii white arrows). (viii) How platelet diameters were measured by TEM (original magnification ×30 000), which confirmed that cell diameters significantly (P < .05) increased in cultured platelets compared with freshly isolated platelets (also see Figure 5Ai). (B) The panels display baseline platelets (far left) and cultured platelets (6 hours) that were left alone or treated with reagents that disrupt microtubular function (ie, nocodazole or taxol). Top row: Specific immunostaining for β-tubulin. Bottom row: Corresponding transmission images. This figure is representative of 3 independent experiments. Scale bars represent 10 μm.
Figure 4
Figure 4
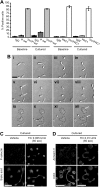
Newly formed cell bodies are functional. (A) The bar graph depicts P-selectin and PAC-1 surface expression (percentage of positive cells) as assessed by flow cytometry in freshly isolated (0 hours) or cultured (6 hours) platelets with or without thrombin (Thr) stimulation for 15 minutes. The data are compared with isotype-matched control antibodies (IgG, IgM). (B) Platelets were cultured in suspension for 6 hours and subsequently placed on immobilized fibrinogen. As shown in these sequential images (i-xii), a platelet process adheres, spreads, and forms 2 distinct cell bodies that eventually separate from one another (gray dashed lines). Scale bar represents 5 μm. Panel B is representative of 4 independent experiments. (C-D) Platelets were cultured for 6 hours and subsequently treated with vehicle or thrombin (0.005 U/mL). After 60 seconds, the platelets were fixed in solution, the permeabilization step was skipped, and then the cells were coimmunostained for (C) P-selectin and sialic acids (WGA) or (D) annexin V and actin. Panels C and D are representative of 3 independent experiments. Scale bars represent 10 μm.
Figure 5
Figure 5
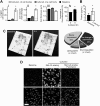
Cultured platelets increase in biomass and accumulate protein. (A) The bars represent the mean ± SEM for diameter (i), volume (ii), thickness (iii), and biomass (iv) of freshly isolated versus cultured platelets. *P < .05 versus baseline (i-iii) or 0 hours (iv). (B) The bars represent the mean ± SEM for total protein concentration of freshly isolated (Baseline) vs cultured platelets. *P < .05 versus baseline. (C) Left panels: Protein expression patterns for freshly isolated (Baseline) versus cultured (6 hours) platelets. These 2-dimensional gels, which are tilted in a third dimension to more effectively display the peak intensity and height of individual proteins, are representative of 5 independent experiments. (Right panel) The pie chart categorizes the protein expression patterns in freshly isolated versus cultured platelets. The categories are labeled as newly expressed (spots identified in cultured platelets that were not present at baseline), up-regulated (spots that were increased in cultured platelets compared with baseline), down-regulated (spots that were decreased in cultured platelets compared with baseline), or no change (spots that remained constant between cultured and baseline platelets). The percentages in the pie chart are the average of 5 independent experiments. (D) Platelets were coincubated with a fluorescent methionine analog (Met AA analog) in the presence or absence of puromycin. The top row identifies incorporation of methionine into newly synthesized protein. The bottom row panels (WGA) identify sialic acids. These panels are representative of 3 independent experiments.
Figure 6
Figure 6
Stored platelets develop new cell bodies and increase in number. (A-B) Ex vivo aged (1 or 4 days) platelets were resuspended in M199 medium and immediately fixed (Baseline) or cultured in suspension for 6 hours. (A) The panels display a representative example of one study where the platelets were stained for actin. Scale bars represent 10 μm. (B) The bar graph indicates the number of ex vivo–aged platelets with at least 2 cell bodies per microliter (mean ± SEM; n = 4). *P < .05, cultured vs baseline. (C) Ex vivo–aged platelets (day 4) were resuspended in culture medium for 6 hours in the presence (far right panels) or absence of thrombin. From left to right in the top row, the top row panels identify αIIbβ3, P-selectin, β-tubulin, control IgG, respiring mitochondria (Mitotracker), or sialic acids (WGA). Corresponding transmission images are shown in the bottom row. Scale bars represent 5 μm. This figure is representative of 3 independent experiments. (D) Platelets were stored under standard blood bank conditions, and platelet counts as well as mean platelet volumes (MPV) were determined. The left graph shows the platelet count before (day 0) and after (day 5) storage (mean ± SEM; n = 10). The right panel displays the MPV obtained from platelets used for the counting studies. *P < .05, day 0 vs day 5, for both panels.

Comment in

  • Platelets in bloom.
    Moake J. Moake J. Blood. 2010 May 6;115(18):3650-1. doi: 10.1182/blood-2010-02-268714. Blood. 2010. PMID: 20448116 No abstract available.

Similar articles

Cited by

References

    1. Geddis AE, Kaushansky K. Immunology: the root of platelet production. Science. 2007;317(5845):1689–1691. - PubMed
    1. Schwertz H, Tolley ND, Foulks JM, et al. Signal-dependent splicing of tissue factor pre-mRNA modulates the thrombogenicity of human platelets. J Exp Med. 2006;203(11):2433–2440. - PMC - PubMed
    1. Qian K, Xie F, Gibson AW, Edberg JC, Kimberly RP, Wu J. Functional expression of IgA receptor FcαRI on human platelets. J Leukoc Biol. 2008;84(6):1492–1500. - PMC - PubMed
    1. Shashkin PN, Brown GT, Ghosh A, Marathe GK, McIntyre TM. Lipopolysaccharide is a direct agonist for platelet RNA splicing. J Immunol. 2008;181(5):3495–3502. - PMC - PubMed
    1. Denis MM, Tolley ND, Bunting M, et al. Escaping the nuclear confines: signal-dependent pre-mRNA splicing in anucleate platelets. Cell. 2005;122(3):379–391. - PMC - PubMed

Publication types