. 2010 Mar 12;285(11):8290-301.
doi: 10.1074/jbc.M109.083196. Epub 2010 Jan 19.

The full-length Saccharomyces cerevisiae Sgs1 protein is a vigorous DNA helicase that preferentially unwinds holliday junctions

Affiliations

The full-length Saccharomyces cerevisiae Sgs1 protein is a vigorous DNA helicase that preferentially unwinds holliday junctions

Petr Cejka et al. J Biol Chem. .

Abstract

The highly conserved RecQ family of DNA helicases has multiple roles in the maintenance of genome stability. Sgs1, the single RecQ homologue in Saccharomyces cerevisiae, acts both early and late during homologous recombination. Here we present the expression, purification, and biochemical analysis of full-length Sgs1. Unlike the truncated form of Sgs1 characterized previously, full-length Sgs1 binds diverse single-stranded and double-stranded DNA substrates, including DNA duplexes with 5'- and 3'-single-stranded DNA overhangs. Similarly, Sgs1 unwinds a variety of DNA substrates, including blunt-ended duplex DNA. Significantly, a substrate containing a Holliday junction is unwound most efficiently. DNA unwinding is catalytic, requires ATP, and is stimulated by replication protein A. Unlike RecQ homologues from multicellular organisms, Sgs1 is remarkably active at picomolar concentrations and can efficiently unwind duplex DNA molecules as long as 23,000 base pairs. Our analysis shows that Sgs1 resembles Escherichia coli RecQ protein more than any of the human RecQ homologues with regard to its helicase activity. The full-length recombinant protein will be invaluable for further investigation of Sgs1 biochemistry.


Figures

FIGURE 1.
FIGURE 1.
Purification of full-length Sgs1 protein. A, diagram of SGS1 constructs. The recombinant protein was expressed in Sf9 cells with an N-terminal MBP tag and a C-terminal His10 tag. During purification, the MBP tag was removed using PreScission protease (PP). Consequently, the resulting Sgs1 protein contained only the C-terminal His10 (10xhis) tag. B, a representative Sgs1 purification showing fractions analyzed by SDS-PAGE. The positions of the recombinant constructs are indicated on the right, and the molecular masses of protein size markers are shown on the left. The gel was photographed after staining with Coomassie Brilliant Blue. C, fractions from the purification of the mutant, Sgs1 (K706A) protein analyzed by SDS-PAGE.
FIGURE 2.
FIGURE 2.
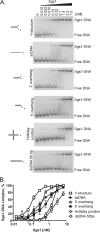
Sgs1 binds to a broad range of DNA substrates. A, electrophoretic mobility shift assays were performed as a function of Sgs1 concentrations with various DNA substrates (150 pm molecules). Shown are representative 6% polyacrylamide gels. DNA substrates are schematically depicted on the left. *, position of the 32P label. B, quantification of experiments as in A, with the Sgs1 concentration plotted on a logarithmic scale. Data represent the average of three experiments. Error bars, S.E.
FIGURE 3.
FIGURE 3.
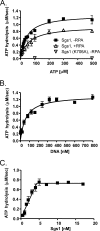
Sgs1 shows DNA-dependent ATPase activity. A, the rate of ATP hydrolysis and its dependence on ATP concentration. The reaction contained Sgs1 or Sgs1 (K706A) (5 nm), poly(dT) (1 μm nucleotides), RPA (0.15 μm; 300% of ssDNA saturation if indicated), and varying concentrations of ATP. The kinetic parameters for ATP hydrolysis (see “Results”) were obtained by fitting to the Michaelis-Menten equation. B, the relationship between ATP hydrolysis and the concentration of DNA. The reactions contained Sgs1 (5 nm), ATP (1 mm), and the indicated concentrations of poly(dT). The kinetic parameters for ATP hydrolysis (see “Results”) were obtained by fitting to the Michaelis-Menten equation. C, the relationship between ATP hydrolysis and Sgs1 concentration. The reactions contained poly(dT) (160 nm nucleotides), ATP (1 mm), and the concentrations of Sgs1 indicated. The data from all panels are the average of at least two independent experiments. Error bars, S.E.
FIGURE 4.
FIGURE 4.
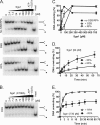
Sgs1 is a DNA helicase. A, representative polyacrylamide gels (10%) showing the DNA helicase activity of Sgs1 on a 32P-labeled Y-structure DNA substrate (150 pm molecules). The substrate and reaction products are illustrated to the right of each gel. *, position of the 32P label. Reactions were incubated for 30 min and, where indicated, supplemented with either S. cerevisiae RPA or E. coli SSB. Control reactions were as follows. −ATP, ATP was omitted from the reaction buffer; +EDTA, EDTA (33 mm) was added. The last lane contains heat-denatured substrate (Heat). B, analysis of the Sgs1 (K706A) mutant protein as in A. C, quantification of helicase assays, such as those shown in A. D, kinetics of unwinding of the Y-structure DNA (150 pm molecules) by 24 pm Sgs1. E, kinetics of unwinding of the Y-structure DNA (150 pm molecules) by 730 pm Sgs1. The results in C–E are the average of at least three experiments. Error bars, S.E.
FIGURE 5.
FIGURE 5.
Sgs1 can unwind a broad range of DNA substrates. The helicase assays were carried out with the indicated 32P-labeled DNA (150 pm molecules). All reactions contained RPA and were incubated for 30 min. A, representative polyacrylamide gels (10%) showing unwinding of four-way junction, 3′-ssDNA overhang, 5′-ssDNA overhang, 31-bp dsDNA, and 50-bp dsDNA. The substrate and product are depicted on the right. *, position of the 32P label. The last lane contains heat-denatured substrate (heat). B, quantification of the helicase assays as in A, with the Sgs1 concentration plotted on a logarithmic scale. C, helicase assays at 240 pm Sgs1 carried out as in A as a function of magnesium acetate concentration. The results are the average of at least three experiments. Error bars, S.E.
FIGURE 6.
FIGURE 6.
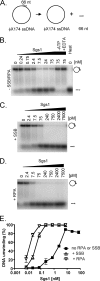
Sgs1 can displace ssDNA annealed to ϕX174 ssDNA. A, a 32P-labeled oligonucleotide (66 nucleotides) was annealed to ϕX174 ssDNA (1 nm molecules) to create the substrate that was used for helicase assays; products were analyzed by electrophoresis, using agarose gels (1%). B, a representative gel for assays carried out without RPA or SSB for 30 min. Substrate and reaction product are depicted on the right. −ATP, control reaction where ATP was omitted; +EDTA, control reaction where EDTA was added at 33 mm; heat, heat-denatured substrate. C, a representative gel for the assay carried out with SSB. D, a representative gel for the assay carried out with RPA. E, quantification of at least three replicate experiments, such as those shown in B–D, with the Sgs1 concentration plotted on a logarithmic scale. Error bars, S.E.
FIGURE 7.
FIGURE 7.
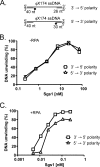
Sgs1 displays a 3′→5′ polarity for DNA unwinding. A helicase assay was carried out with the indicated Sgs1 concentrations and DNA substrates (1 nm molecules). A, a schematic representation of the DNA substrates used to define translocation polarity, 3′→5′ polarity, or 5′→3′ polarity; see “Results” for details. B, quantification of three replicate experiments carried out without RPA, with the Sgs1 concentration plotted on a logarithmic scale. C, quantification of three replicate experiments carried out with RPA, with Sgs1 concentration plotted on a logarithmic scale.
FIGURE 8.
FIGURE 8.
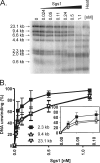
Sgs1 can unwind long lengths of dsDNA. A, λ phage DNA was digested with HindIII and 32P-labeled with Klenow fragment of DNA polymerase I at the 3′-ends. This substrate (each fragment at 50 pm molecules) was used for helicase assays at the indicated Sgs1 concentrations. The reactions were carried out in the presence of RPA. Sizes of the dsDNA substrates are indicated on the left. Heat, heat-denatured substrate. The panel shows a representative agarose gel (1%). B, quantification of unwinding of the 23.1-, 9.4-, and 2.3-kb DNA fragments. The quantification was based on the disappearance of the bands corresponding to the respective dsDNA fragment. The results are the average of three experiments. Error bars, S.E.

References

    1. Nakayama H., Nakayama K., Nakayama R., Irino N., Nakayama Y., Hanawalt P. C. (1984) Mol. Gen. Genet. 195, 474–480 - PubMed
    1. Gangloff S., McDonald J. P., Bendixen C., Arthur L., Rothstein R. (1994) Mol. Cell. Biol. 14, 8391–8398 - PMC - PubMed
    1. Watt P. M., Louis E. J., Borts R. H., Hickson I. D. (1995) Cell 81, 253–260 - PubMed
    1. Wu L., Hickson I. D. (2006) Annu. Rev. Genet. 40, 279–306 - PubMed
    1. Ellis N. A., Groden J., Ye T. Z., Straughen J., Lennon D. J., Ciocci S., Proytcheva M., German J. (1995) Cell 83, 655–666 - PubMed

Publication types

MeSH terms

LinkOut - more resources