. 2010:6:343.
doi: 10.1038/msb.2009.98. Epub 2010 Jan 19.

A side effect resource to capture phenotypic effects of drugs

Affiliations

A side effect resource to capture phenotypic effects of drugs

Michael Kuhn et al. Mol Syst Biol. 2010.

Abstract

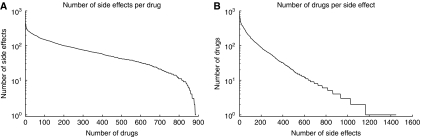
The molecular understanding of phenotypes caused by drugs in humans is essential for elucidating mechanisms of action and for developing personalized medicines. Side effects of drugs (also known as adverse drug reactions) are an important source of human phenotypic information, but so far research on this topic has been hampered by insufficient accessibility of data. Consequently, we have developed a public, computer-readable side effect resource (SIDER) that connects 888 drugs to 1450 side effect terms. It contains information on frequency in patients for one-third of the drug-side effect pairs. For 199 drugs, the side effect frequency of placebo administration could also be extracted. We illustrate the potential of SIDER with a number of analyses. The resource is freely available for academic research at http://sideeffects.embl.de.


Conflict of interest statement

In addition to his employment at the European Molecular Biology Laboratory (EMBL), IL is also the Chief Executive Officer of biobyte solutions GmbH, which handles commercial licensing of SIDER for EMBL.

Figures

Figure 1
Figure 1
Statistics of the database. (A) The number of side effects is counted for each drug and the number of drugs is plotted versus the number of side effects per drug. For example, there are about 200 drugs with at least 100 side effects. (B) Similar to A, the number of drugs per side effects is plotted.
Figure 2
Figure 2
Analysis of side effects. (A) Overview of the different categories of drugs. Drugs are grouped by their drug class. The number of shared and unique drugs and side effects is shown for each class. (Some drugs, e.g., aspirin, have more than one anatomical class assigned to them.) (B) Using Fisher's exact test, over-represented side effects were determined for each category. A few over-represented medical concepts might describe indications for the drugs (e.g., ‘cancer') that were not caught by our filtering mechanisms (see Materials and methods). These concepts are marked with an asterisk. (C) Associations between drug classes and anatomical classes of side effects are shown (see Supplementary Information). Positive values indicate an association between a drug and an anatomical class. Negative values represent an under-representation, for example, drugs indicated for disorders of the blood system cause few sensory side effects.
Figure 3
Figure 3
(A) For the different side effect frequency classes, the number of drug–side effect pairs is shown. For a fraction of the side effects an exact frequency (e.g., ‘3%') is known, whereas for others only the general frequency class (e.g., ‘frequent') is given in package inserts. When an exact frequency is given on the labels, the corresponding frequency of the side effect in the control (placebo) group is often also available. (B) The number of drug–side effect pairs with specific frequencies is counted. Exact frequency ranges are in many cases only given for side effects occurring in at least 1% of the patients, therefore the first bin (<1%) of the histogram has a lower abundance than the second bin (1–2%). (C) Frequencies obtained from the administration of drug and placebo during clinical trials are compared. In panels C and D, the blue line stands for equal frequency and the red line for side effects that are twice as frequent after drug treatment than in the control group. (D) For each side effect, the median frequency in drug and placebo administration is computed. The area of the circles corresponds to the number of drugs with the side effect and available placebo information. (See Supplementary Figure S2 for adapted versions of C and D that resolve the cloud of points near the origin.).

Similar articles

Cited by

References

    1. Ashburn TT, Thor KB (2004) Drug repositioning: identifying and developing new uses for existing drugs. Nat Rev Drug Discov 3: 673–683 - PubMed
    1. Barsky AJ, Saintfort R, Rogers MP, Borus JF (2002) Nonspecific medication side effects and the nocebo phenomenon. JAMA 287: 622–627 - PubMed
    1. Bender A, Scheiber J, Glick M, Davies JW, Azzaoui K, Hamon J, Urban L, Whitebread S, Jenkins JL (2007) Analysis of pharmacology data and the prediction of adverse drug reactions and off-target effects from chemical structure. Chem Med Chem 2: 861–873 - PubMed
    1. Campillos M, Kuhn M, Gavin AC, Jensen LJ, Bork P (2008) Drug target identification using side-effect similarity. Science 321: 263–266 - PubMed
    1. Fliri AF, Loging WT, Volkmann RA (2007) Analysis of system structure-function relationships. Chem Med Chem 2: 1774–1782 - PubMed

Publication types

Substances