

Systematic image-driven analysis of the spatial Drosophila embryonic expression landscape
- PMID: 20087342
- PMCID: PMC2824522
- DOI: 10.1038/msb.2009.102
Systematic image-driven analysis of the spatial Drosophila embryonic expression landscape
Abstract
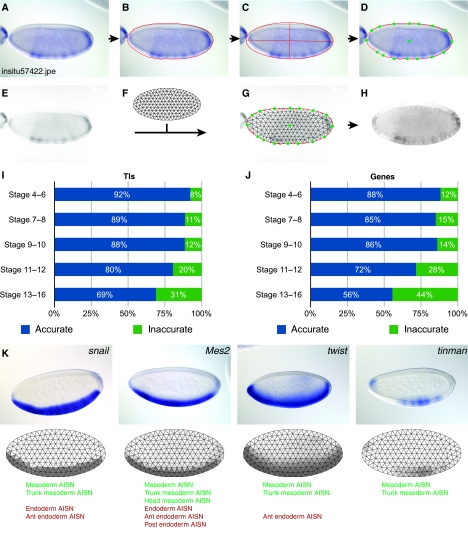
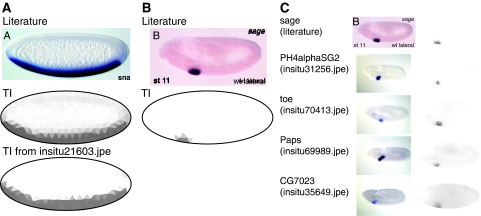
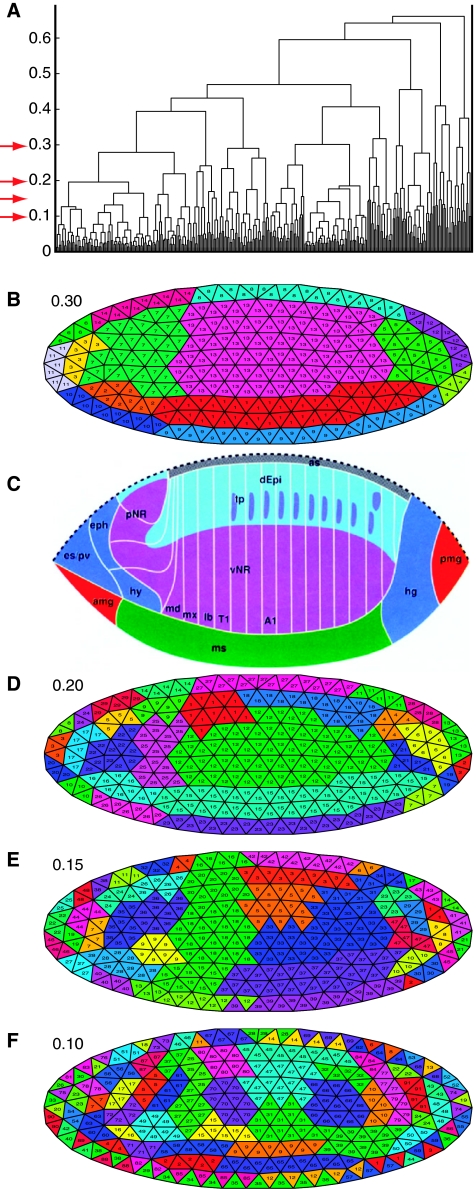
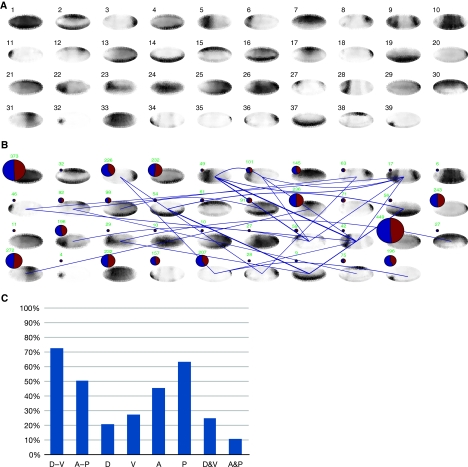
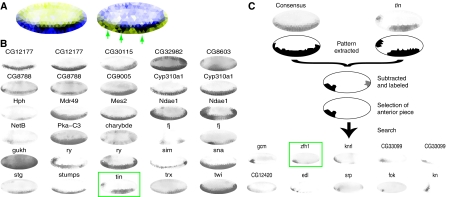
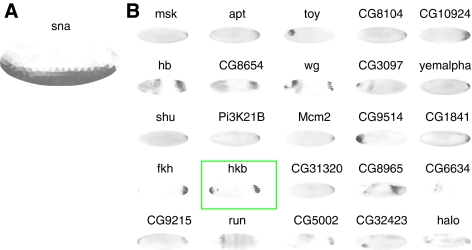
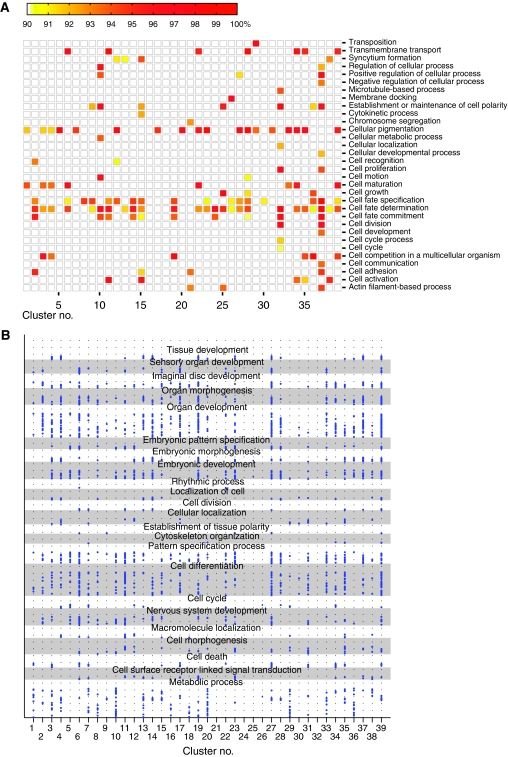
Discovery of temporal and spatial patterns of gene expression is essential for understanding the regulatory networks and development in multicellular organisms. We analyzed the images from our large-scale spatial expression data set of early Drosophila embryonic development and present a comprehensive computational image analysis of the expression landscape. For this study, we created an innovative virtual representation of embryonic expression patterns using an elliptically shaped mesh grid that allows us to make quantitative comparisons of gene expression using a common frame of reference. Demonstrating the power of our approach, we used gene co-expression to identify distinct expression domains in the early embryo; the result is surprisingly similar to the fate map determined using laser ablation. We also used a clustering strategy to find genes with similar patterns and developed new analysis tools to detect variation within consensus patterns, adjacent non-overlapping patterns, and anti-correlated patterns. Of the 1800 genes investigated, only half had previously assigned functions. The known genes suggest developmental roles for the clusters, and identification of related patterns predicts requirements for co-occurring biological functions.
Figures
Similar articles
-
A mesh generation and machine learning framework for Drosophila gene expression pattern image analysis.BMC Bioinformatics. 2013 Dec 28;14:372. doi: 10.1186/1471-2105-14-372. BMC Bioinformatics. 2013. PMID: 24373308 Free PMC article.
-
Deciphering a transcriptional regulatory code: modeling short-range repression in the Drosophila embryo.Mol Syst Biol. 2010;6:341. doi: 10.1038/msb.2009.97. Epub 2010 Jan 19. Mol Syst Biol. 2010. PMID: 20087339 Free PMC article.
-
A methodology to infer gene networks from spatial patterns of expression--an application to fluorescence in situ hybridization images.Mol Biosyst. 2013 Jul;9(7):1926-30. doi: 10.1039/c3mb25475e. Epub 2013 Apr 17. Mol Biosyst. 2013. PMID: 23591446 Free PMC article.
-
Conservation and divergence in developmental networks: a view from Drosophila myogenesis.Curr Opin Cell Biol. 2009 Dec;21(6):754-60. doi: 10.1016/j.ceb.2009.10.001. Epub 2009 Nov 4. Curr Opin Cell Biol. 2009. PMID: 19896355 Review.
-
Modeling transcriptional networks in Drosophila development at multiple scales.Curr Opin Genet Dev. 2011 Dec;21(6):711-8. doi: 10.1016/j.gde.2011.07.005. Epub 2011 Sep 1. Curr Opin Genet Dev. 2011. PMID: 21889888 Review.
Cited by
-
RNA Granules: A View from the RNA Perspective.Molecules. 2020 Jul 8;25(14):3130. doi: 10.3390/molecules25143130. Molecules. 2020. PMID: 32650583 Free PMC article. Review.
-
Deep Model Based Transfer and Multi-Task Learning for Biological Image Analysis.IEEE Trans Big Data. 2020 Jun;6(2):322-333. doi: 10.1109/tbdata.2016.2573280. Epub 2016 May 30. IEEE Trans Big Data. 2020. PMID: 36846743 Free PMC article.
-
Structural and functional organization of germ plasm condensates.Biochem J. 2022 Dec 19;479(24):2477-2495. doi: 10.1042/BCJ20210815. Biochem J. 2022. PMID: 36534469 Free PMC article. Review.
-
A mesh generation and machine learning framework for Drosophila gene expression pattern image analysis.BMC Bioinformatics. 2013 Dec 28;14:372. doi: 10.1186/1471-2105-14-372. BMC Bioinformatics. 2013. PMID: 24373308 Free PMC article.
-
Building quantitative, three-dimensional atlases of gene expression and morphology at cellular resolution.Wiley Interdiscip Rev Dev Biol. 2013 Nov-Dec;2(6):767-79. doi: 10.1002/wdev.107. Epub 2013 Feb 4. Wiley Interdiscip Rev Dev Biol. 2013. PMID: 24123936 Free PMC article. Review.
References
-
- Abrams EW, Mihoulides WK, Andrew DJ (2006) Fork head and Sage maintain a uniform and patent salivary gland lumen through regulation of two downstream target genes, PH4alphaSG1 and PH4alphaSG2. Development 133: 3517–3527 - PubMed
-
- Adams MD, Celniker SE, Holt RA, Evans CA, Gocayne JD, Amanatides PG, Scherer SE, Li PW, Hoskins RA, Galle RF, George RA, Lewis SE, Richards S, Ashburner M, Henderson SN, Sutton GG, Wortman JR, Yandell MD, Zhang Q, Chen LX et al. (2000) The genome sequence of Drosophila melanogaster. Science 287: 2185–2195 - PubMed
-
- Bonini NM, Fortini ME (1999) Surviving Drosophila eye development: integrating cell death with differentiation during formation of a neural structure. Bioessays 21: 991–1003 - PubMed
-
- Bookstein F (1989) Principal warps: thin-plate splines and the decomposition of deformations. IEEE Trans Pattern Anal Mach Intell 11: 567–585
-
- Broihier HT, Moore LA, Van Doren M, Newman S, Lehmann R (1998) zfh-1 is required for germ cell migration and gonadal mesoderm development in Drosophila. Development 125: 655–666 - PubMed
Publication types
MeSH terms
Substances
Grants and funding
LinkOut - more resources
Full Text Sources
Molecular Biology Databases
