. 2010 Sep 15;13(6):797-805.
doi: 10.1089/ars.2009.2932.

Role of mitochondrial DNA damage in the development of diabetic retinopathy, and the metabolic memory phenomenon associated with its progression

Affiliations

Role of mitochondrial DNA damage in the development of diabetic retinopathy, and the metabolic memory phenomenon associated with its progression

Sally A Madsen-Bouterse et al. Antioxid Redox Signal. .

Abstract

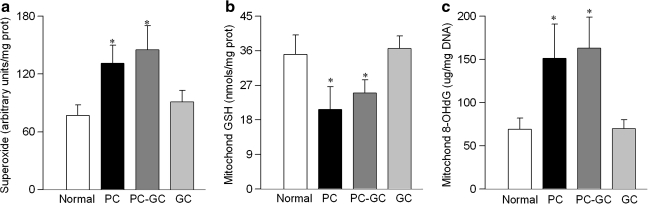
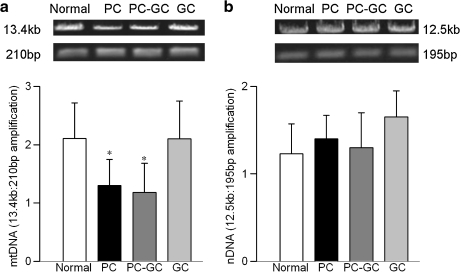
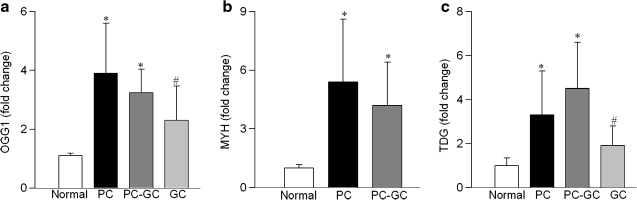
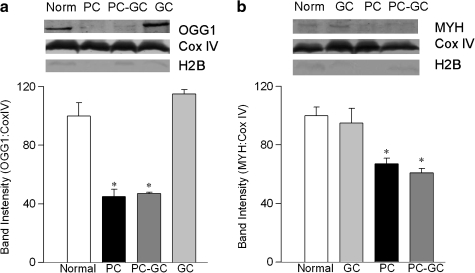
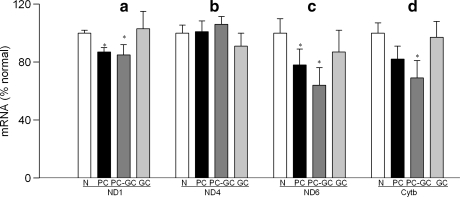
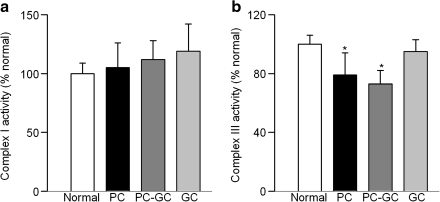
Diabetic retinopathy does not halt after hyperglycemia is terminated; the retina continues to experience increased oxidative stress, suggesting a memory phenomenon. Mitochondrial DNA (mtDNA) is highly sensitive to oxidative damage. The goal is to investigate the role of mtDNA damage in the development of diabetic retinopathy, and in the metabolic memory. mtDNA damage and its functional consequences on electron transport chain (ETC) were analyzed in the retina from streptozotocin-diabetic rats maintained in poor control (PC, glycated hemoglobin >11%) for 12 months or PC for 6 months followed by good control (GC, GHb < 6.5%) for 6 months. Diabetes damaged retinal mtDNA and elevated DNA repair enzymes (glycosylase). ETC proteins that were encoded by the mitochondrial genome and the glycosylases were compromised in the mitochondria. Re-institution of GC after 6 months of PC failed to protect mtDNA damage, and ETC proteins remained subnormal. Thus, mtDNA continues to be damaged even after PC is terminated. Although the retina tries to overcome mtDNA damage by inducing glycosylase, they remain deficient in the mitochondria with a compromised ETC system. The process is further exacerbated by subsequent increased mtDNA damage providing no relief to the retina from a continuous cycle of damage, and termination of hyperglycemia fails to arrest the progression of retinopathy.


Figures

FIG. 1.
FIG. 1.
Retinal mitochondrial oxidative stress is increased in diabetes. Freshly isolated retinal mitochondria were used to measure (a) superoxide levels by lucigenin method, (b) GSH levels by a colorimetric method, and (c) 8-OHdG by an ELISA. Results are mean ± SD of the measurements made in duplicate in 5–8 rats in each group. Normal, age-matched normal control; PC, poor glycemic control; PC-GC, 6 months poor glycemic control followed by 6 months good glycemic control; GC, good glycemic control for the entire 12 months. *p< 0.05 compared to normal.
FIG. 2.
FIG. 2.
Termination of hyperglycemia fails to reverse diabetes-induced retinal mtDNA damage. (a) MtDNA damage was assessed using 15 ng total retinal DNA and mitochondrial-specific primers for long and short PCR product: long, forward-AAA ATC CCC GCA AAC AAT GAC CAC CCC and reverse-GGC AAT TAA GAG TGG GAT GGA GCC AA; and short, forward-CCT CCC ATT CAT TAT CGC CGC CCT TGC and reverse-GTC TGG GTC TCC TAG TAG GTC TGG GAA, respectively. The relative amplification was calculated by normalizing the intensity of the 13.4 kb product to the 210 bp product. (b) For nDNA damage the primers used were: long, forward-AGA CGG GTG AGA CAG CTG CAC CTT TTC and reverse-CGA GAG CAT CAA GTG CAG GCA TTA GAG, and short, forward-GGT GTA CTT GAG CAG AGC GCT ATA AAT and reverse-CAC TTA CCC ACG GCA GCT CTC TAC, and the relative amplification of 12.5 kb and 195 bp products was calculated. Results represent values obtained from 5 or more rats in each group. Normal, age-matched normal control; PC, poor glycemic control; PC-GC, 6 months poor glycemic control followed by 6 months good glycemic control; GC, good glycemic control for the entire duration of diabetes. *p < 0.05 compared to normal.
FIG. 3.
FIG. 3.
Diabetes increases the gene expressions of DNA repair enzymes in the retina. RNA isolated from the retina was assessed by real-time RT-PCR for (a) OGG1, (b) MYH, and (c) TDG, and was normalized to B2M in each sample. Fold-change relative to normal age-matched controls was calculated using the ddCt method. Results are from the measurements made in 5 or more rats in each group. *p < 0.05 compared to normal and #p < 0.05 compared to PC.
FIG. 4.
FIG. 4.
Decreased protein abundance of DNA glycosylases in retinal mitochondria is not reversed by good glycemic control. Retinal mitochondrial protein (20 μg) was separated on 10% polyacrylamide gels, transferred to nitrocellulose, and analyzed by Western blot using polyclonal antibodies for OGG1 (a) and MYH (b) with Cox IV as a loading control. To evaluate nuclear contamination, the membranes were screened for Histone H2B expression. Histograms represent band intensities of OGG1 and MYH, respectively, normalized to that of Cox IV. The values are presented as the mean + SD of 4 rats in each group. *p < 0.05 compared to normal.
FIG. 5.
FIG. 5.
Mitochondrial-encoded genes continue to be altered in the retina after hyperglycemia is terminated. Transcript abundance was assessed in DNase-treated RNA isolated from retina using conventional RT-PCR for (a) ND1, (b) ND4, (c) ND6 of complex I, and (d) cytochrome b of complex III. Relative mRNA abundance was quantified using Un-Scan-It Gel digitizing software, and the values in the figures are presented as mean band intensity of the target gene normalized by the intensity of β-actin. The values obtained from normal rats are considered 100%. Results are from the measurements made in 4–6 rats in each group. N, age-matched normal control; PC, poor glycemic control; PC-GC, 6 months poor glycemic control followed by 6 months good glycemic control; *p < 0.05 compared to normal.
FIG. 6.
FIG. 6.
Reversal of hyperglycemia does not normalize the reduction in retinal complex III activity. (a) Complex I activity was assayed in retinal mitochondria by measuring the consumption of NADH at 340 nm. (b) Complex III activity was assessed by measuring the reduction of cytochrome c at 550 nm. Values from normal rat retina mitochondria are considered 100%. *p < 0.05 compared to normal.

Similar articles

Cited by

References

    1. Ayala–Torres S. Chen Y. Svoboda T. Rosenblatt J. Van Houten B. Analysis of gene-specific DNA damage and repair using quantitative polymerase chain reaction. Methods. 2000;22:135–147. - PubMed
    1. Bai Y. Attardi G. The mtDNA-encoded ND6 subunit of mitochondrial NADH dehydrogenase is essential for the assembly of the membrane arm and the respiratory function of the enzyme. EMBO J. 1998;17:4848–4858. - PMC - PubMed
    1. Ballinger SW. Bouder TG. Davis GS. Judice SA. Nicklas JA. Albertini RJ. Mitochondrial genome damage associated with cigarette smoking. Cancer Res. 1996;56:5692–5697. - PubMed
    1. Ballinger SW. Van Houtens B. Jin GF. Conklin CA. Godley BF. Hydrogen peroxide causes significant mitochondrial DNA damage in human RPE cells. Exp Eye Res. 1999;68:765–772. - PubMed
    1. Bourges I. Ramus C. Mousson de Camaret B. Beugnot R. Remacle C. Cardol P. Hofhaus G. Issartel JP. Structural organization of mitochondrial human complex. I: Role of the ND4 and ND5 mitochondria-encoded subunits and interaction with prohibitin. Biochem J. 2004;383:491–799. - PMC - PubMed

Publication types

Substances