

Spatio-temporal trends of mortality in small areas of Southern Spain
- PMID: 20089142
- PMCID: PMC2881099
- DOI: 10.1186/1471-2458-10-26
Spatio-temporal trends of mortality in small areas of Southern Spain
Abstract
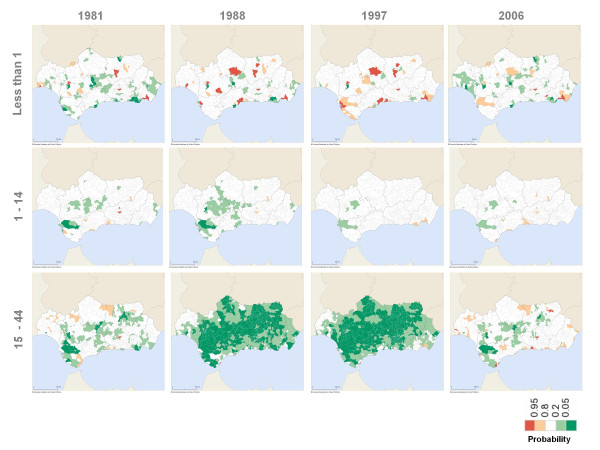
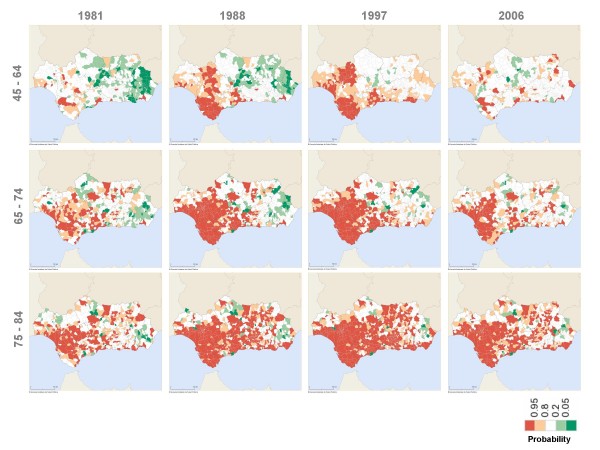
Background: Most mortality atlases show static maps from count data aggregated over time. This procedure has several methodological problems and serious limitations for decision making in Public Health. The evaluation of health outcomes, including mortality, should be approached from a dynamic time perspective that is specific for each gender and age group. At the moment, researches in Spain do not provide a dynamic image of the population's mortality status from a spatio-temporal point of view. The aim of this paper is to describe the spatial distribution of mortality from all causes in small areas of Andalusia (Southern Spain) and evolution over time from 1981 to 2006.
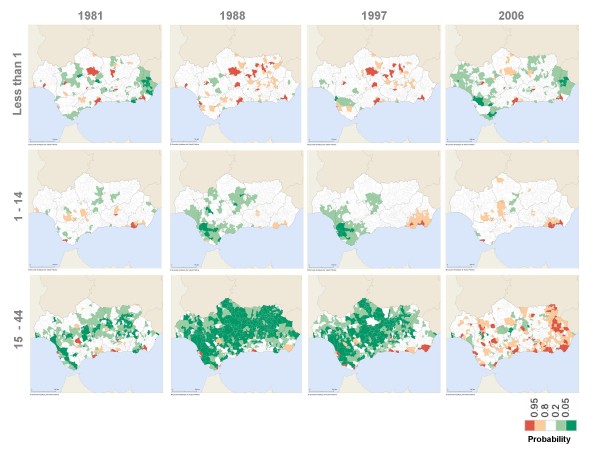
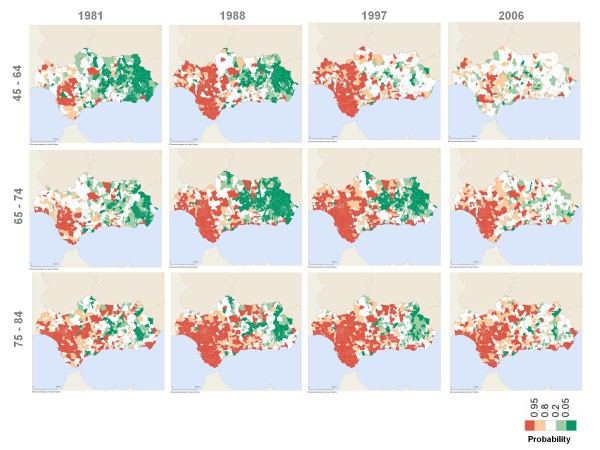
Methods: A small-area ecological study was devised using the municipality as the unit for analysis. Two spatio-temporal hierarchical Bayesian models were estimated for each age group and gender. One of these was used to estimate the specific mortality rate, together with its time trends, and the other to estimate the specific rate ratio for each municipality compared with Spain as a whole.
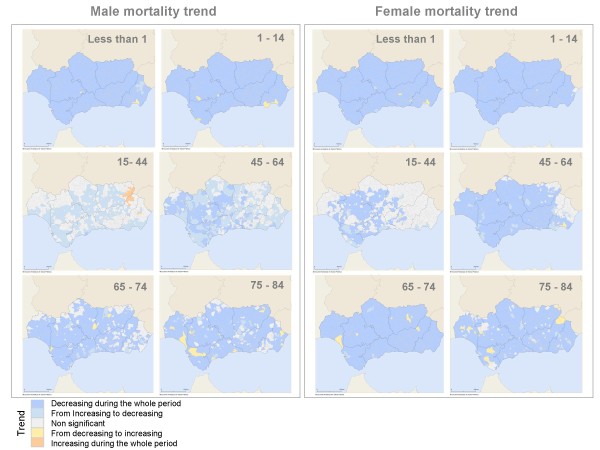
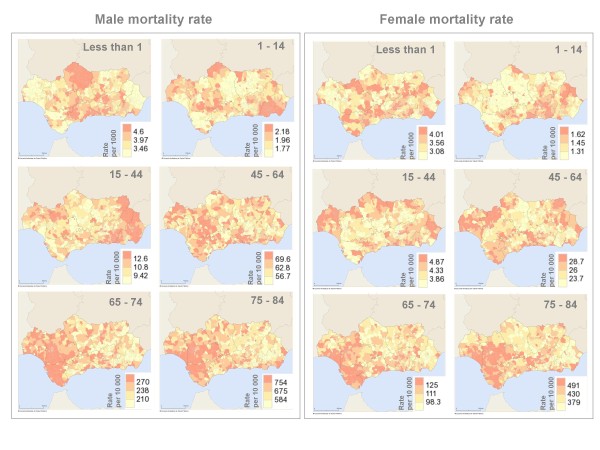
Results: More than 97% of the municipalities showed a diminishing or flat mortality trend in all gender and age groups. In 2006, over 95% of municipalities showed male and female mortality specific rates similar or significantly lower than Spanish rates for all age groups below 65. Systematically, municipalities in Western Andalusia showed significant male and female mortality excess from 1981 to 2006 only in age groups over 65.
Conclusions: The study shows a dynamic geographical distribution of mortality, with a different pattern for each year, gender and age group. This information will contribute towards a reflection on the past, present and future of mortality in Andalusia.
Figures
Similar articles
-
Geographical and Temporal Variations in Female Breast Cancer Mortality in the Municipalities of Andalusia (Southern Spain).Int J Environ Res Public Health. 2016 Nov 22;13(11):1162. doi: 10.3390/ijerph13111162. Int J Environ Res Public Health. 2016. PMID: 27879690 Free PMC article.
-
[Interactive mortality atlas in Andalusia, Spain (AIMA)].Rev Esp Salud Publica. 2008 Jul-Aug;82(4):379-94. doi: 10.1590/s1135-57272008000400003. Rev Esp Salud Publica. 2008. PMID: 18714417 Spanish.
-
Trends in socioeconomic inequalities in mortality in small areas of 33 Spanish cities.BMC Public Health. 2016 Jul 29;16:663. doi: 10.1186/s12889-016-3190-y. BMC Public Health. 2016. PMID: 27473140 Free PMC article.
-
[State of health of populations residing in geothermal areas of Tuscany].Epidemiol Prev. 2012 Sep-Oct;36(5 Suppl 1):1-104. Epidemiol Prev. 2012. PMID: 23139155 Italian.
-
[Mortality Atlas of the Campania Region. All-cause and cause-specific mortality at municipal level, 2006-2014].Epidemiol Prev. 2020 Jan-Feb;44(1 Suppl 1):1-144. doi: 10.19191/EP20.1.S1.P001.003. Epidemiol Prev. 2020. PMID: 33565290 Review. Italian.
Cited by
-
Health status convergence at the local level: empirical evidence from Austria.Int J Equity Health. 2011 Aug 24;10:34. doi: 10.1186/1475-9276-10-34. Int J Equity Health. 2011. PMID: 21864364 Free PMC article.
-
Smoothed Temporal Atlases of Age-Gender All-Cause Mortality in South Africa.Int J Environ Res Public Health. 2017 Sep 15;14(9):1072. doi: 10.3390/ijerph14091072. Int J Environ Res Public Health. 2017. PMID: 28914783 Free PMC article.
-
Mapping subnational HIV mortality in six Latin American countries with incomplete vital registration systems.BMC Med. 2021 Jan 8;19(1):4. doi: 10.1186/s12916-020-01876-4. BMC Med. 2021. PMID: 33413343 Free PMC article.
-
Bayesian Estimation of Age-Specific Mortality and Life Expectancy for Small Areas With Defective Vital Records.Demography. 2018 Aug;55(4):1363-1388. doi: 10.1007/s13524-018-0695-2. Demography. 2018. PMID: 29978339
-
Geographical and Temporal Variations in Female Breast Cancer Mortality in the Municipalities of Andalusia (Southern Spain).Int J Environ Res Public Health. 2016 Nov 22;13(11):1162. doi: 10.3390/ijerph13111162. Int J Environ Res Public Health. 2016. PMID: 27879690 Free PMC article.
References
-
- Gundersen L. Mapping it out: using atlases to detect patterns in health care, disease and mortality. Ann Intern Med. 2000;133:161–164. - PubMed
-
- Banerjee S, Carlin BP, Gelfand AE. Hierarchical modelling and analysis for spatial data. Boca Raton: Chapman & Hall/CRC; 2004.
-
- Greenland S, Rothman KJ, Lash TL. In: Modern Epidemiology. 3. Rothman KJ, Greenland S, Lash TL, editor. Philadelphia: Lippincott Williams & Wilkins; 2008. Measures of effect and measures of association; pp. 51–70.
MeSH terms
LinkOut - more resources
Full Text Sources
Miscellaneous
