

Integrating multiple genome annotation databases improves the interpretation of microarray gene expression data
- PMID: 20089164
- PMCID: PMC2827411
- DOI: 10.1186/1471-2164-11-50
Integrating multiple genome annotation databases improves the interpretation of microarray gene expression data
Abstract
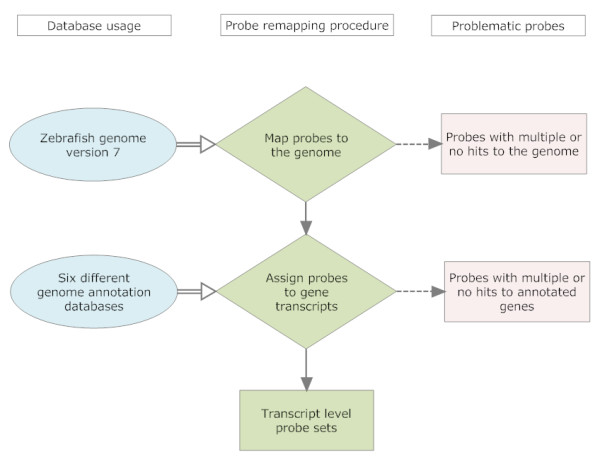
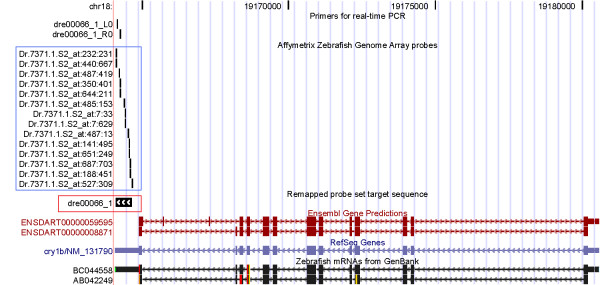
Background: The Affymetrix GeneChip is a widely used gene expression profiling platform. Since the chips were originally designed, the genome databases and gene definitions have been considerably updated. Thus, more accurate interpretation of microarray data requires parallel updating of the specificity of GeneChip probes. We propose a new probe remapping protocol, using the zebrafish GeneChips as an example, by removing nonspecific probes, and grouping the probes into transcript level probe sets using an integrated zebrafish genome annotation. This genome annotation is based on combining transcript information from multiple databases. This new remapping protocol, especially the new genome annotation, is shown here to be an important factor in improving the interpretation of gene expression microarray data.
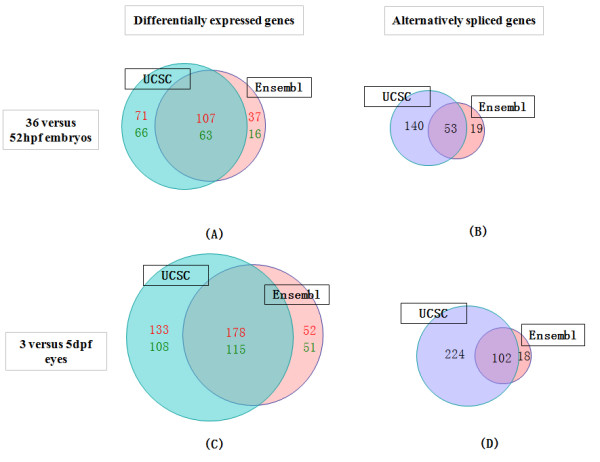
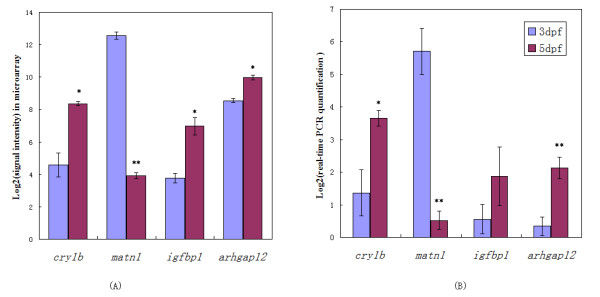
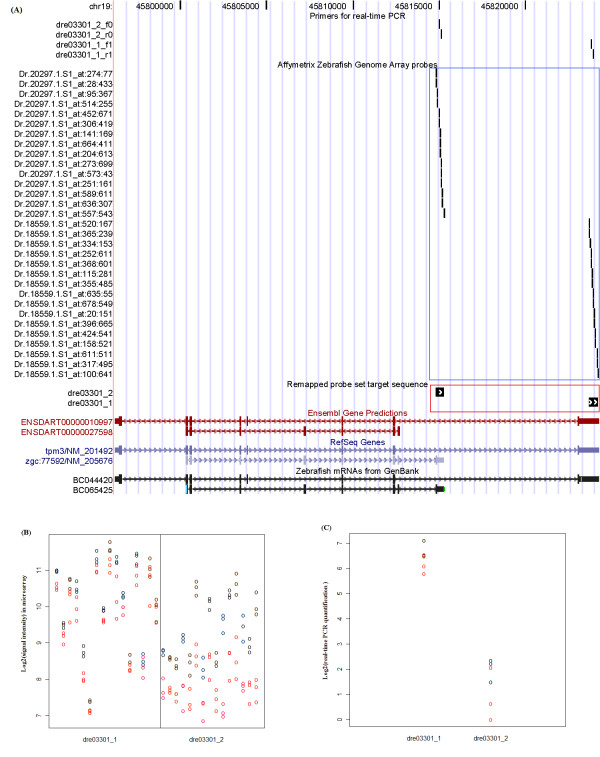
Results: Transcript data from the RefSeq, GenBank and Ensembl databases were downloaded from the UCSC genome browser, and integrated to generate a combined zebrafish genome annotation. Affymetrix probes were filtered and remapped according to the new annotation. The influence of transcript collection and gene definition methods was tested using two microarray data sets. Compared to remapping using a single database, this new remapping protocol results in up to 20% more probes being retained in the remapping, leading to approximately 1,000 more genes being detected. The differentially expressed gene lists are consequently increased by up to 30%. We are also able to detect up to three times more alternative splicing events. A small number of the bioinformatics predictions were confirmed using real-time PCR validation.
Conclusions: By combining gene definitions from multiple databases, it is possible to greatly increase the numbers of genes and splice variants that can be detected in microarray gene expression experiments.
Figures
Similar articles
-
Transcript-level annotation of Affymetrix probesets improves the interpretation of gene expression data.BMC Bioinformatics. 2007 Jun 11;8:194. doi: 10.1186/1471-2105-8-194. BMC Bioinformatics. 2007. PMID: 17559689 Free PMC article.
-
Transcript-based redefinition of grouped oligonucleotide probe sets using AceView: high-resolution annotation for microarrays.BMC Bioinformatics. 2007 Mar 29;8:108. doi: 10.1186/1471-2105-8-108. BMC Bioinformatics. 2007. PMID: 17394657 Free PMC article.
-
A verification protocol for the probe sequences of Affymetrix genome arrays reveals high probe accuracy for studies in mouse, human and rat.BMC Bioinformatics. 2007 Apr 20;8:132. doi: 10.1186/1471-2105-8-132. BMC Bioinformatics. 2007. PMID: 17448222 Free PMC article.
-
Bioinformatics analysis of alternative splicing.Brief Bioinform. 2005 Mar;6(1):23-33. doi: 10.1093/bib/6.1.23. Brief Bioinform. 2005. PMID: 15826354 Review.
-
The importance of biological databases in biological discovery.Curr Protoc Bioinformatics. 2006 Mar;Chapter 1:Unit 1.1. doi: 10.1002/0471250953.bi0101s13. Curr Protoc Bioinformatics. 2006. PMID: 18428753 Review.
Cited by
-
VESPUCCI: Exploring Patterns of Gene Expression in Grapevine.Front Plant Sci. 2016 May 10;7:633. doi: 10.3389/fpls.2016.00633. eCollection 2016. Front Plant Sci. 2016. PMID: 27242836 Free PMC article.
-
First step toward gene expression data integration: transcriptomic data acquisition with COMMAND>_.BMC Bioinformatics. 2019 Jan 28;20(1):54. doi: 10.1186/s12859-019-2643-6. BMC Bioinformatics. 2019. PMID: 30691411 Free PMC article.
-
rePROBE: Workflow for Revised Probe Assignment and Updated Probe-set Annotation in Microarrays.Genomics Proteomics Bioinformatics. 2021 Dec;19(6):1043-1049. doi: 10.1016/j.gpb.2020.06.007. Epub 2021 Feb 11. Genomics Proteomics Bioinformatics. 2021. PMID: 33581338 Free PMC article.
-
A chromosome-scale genome assembly for the holly (Ilex polyneura) provides insights into genomic adaptations to elevation in Southwest China.Hortic Res. 2022 Jan 5;9:uhab049. doi: 10.1093/hr/uhab049. Hortic Res. 2022. PMID: 35031793 Free PMC article.
-
Deciphering combinations of PI3K/AKT/mTOR pathway drugs augmenting anti-angiogenic efficacy in vivo.PLoS One. 2014 Aug 21;9(8):e105280. doi: 10.1371/journal.pone.0105280. eCollection 2014. PLoS One. 2014. PMID: 25144531 Free PMC article.
References
-
- Liu H, Zeeberg BR, Qu G, Koru AG, Ferrucci A, Kahn A, Ryan MC, Nuhanovic A, Munson PJ, Reinhold WC, Kane DW, Weinstein JN. AffyProbeMiner: a web resource for computing or retrieving accurately redefined Affymetrix probe sets. Bioinformatics. 2007;23:2385–2390. doi: 10.1093/bioinformatics/btm360. - DOI - PubMed
Publication types
MeSH terms
Substances
LinkOut - more resources
Full Text Sources
Other Literature Sources
Molecular Biology Databases
