Historical biogeography of the land snail Cornu aspersum: a new scenario inferred from haplotype distribution in the Western Mediterranean basin
- PMID: 20089175
- PMCID: PMC2826328
- DOI: 10.1186/1471-2148-10-18
Historical biogeography of the land snail Cornu aspersum: a new scenario inferred from haplotype distribution in the Western Mediterranean basin
Abstract
Background: Despite its key location between the rest of the continent and Europe, research on the phylogeography of north African species remains very limited compared to European and North American taxa. The Mediterranean land mollusc Cornu aspersum (= Helix aspersa) is part of the few species widely sampled in north Africa for biogeographical analysis. It then provides an excellent biological model to understand phylogeographical patterns across the Mediterranean basin, and to evaluate hypotheses of population differentiation. We investigated here the phylogeography of this land snail to reassess the evolutionary scenario we previously considered for explaining its scattered distribution in the western Mediterranean, and to help to resolve the question of the direction of its range expansion (from north Africa to Europe or vice versa). By analysing simultaneously individuals from 73 sites sampled in its putative native range, the present work provides the first broad-scale screening of mitochondrial variation (cyt b and 16S rRNA genes) of C. aspersum.
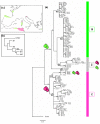
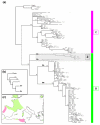
Results: Phylogeographical structure mirrored previous patterns inferred from anatomy and nuclear data, since all haplotypes could be ascribed to a B (West) or a C (East) lineage. Alternative migration models tested confirmed that C. aspersum most likely spread from north Africa to Europe. In addition to Kabylia in Algeria, which would have been successively a centre of dispersal and a zone of secondary contacts, we identified an area in Galicia where genetically distinct west and east type populations would have regained contact.
Conclusions: Vicariant and dispersal processes are reviewed and discussed in the light of signatures left in the geographical distribution of the genetic variation. In referring to Mediterranean taxa which show similar phylogeographical patterns, we proposed a parsimonious scenario to account for the "east-west" genetic splitting and the northward expansion of the western (B) clade which roughly involves (i) the dispersal of ancestral (eastern) types through Oligocene terranes in the Western Mediterranean (ii) the Tell Atlas orogenesis as gene flow barrier between future west and east populations, (iii) the impact of recurrent climatic fluctuations from mid-Pliocene to the last ice age, (iv) the loss of the eastern lineage during Pleistocene northwards expansion phases.
Figures


Similar articles
-
Refining the biogeographical scenario of the land snail Cornu aspersum aspersum: Natural spatial expansion and human-mediated dispersal in the Mediterranean basin.Mol Phylogenet Evol. 2018 Mar;120:218-232. doi: 10.1016/j.ympev.2017.12.018. Epub 2017 Dec 13. Mol Phylogenet Evol. 2018. PMID: 29247848
-
Evolutionary history of the land snail Helix aspersa in the Western Mediterranean: preliminary results inferred from mitochondrial DNA sequences.Mol Ecol. 2001 Jan;10(1):81-7. doi: 10.1046/j.1365-294x.2001.01145.x. Mol Ecol. 2001. PMID: 11251789
-
Shell shape of the land snail Cornu aspersum in North Africa: unexpected evidence of a phylogeographical splitting.Heredity (Edinb). 2003 Sep;91(3):224-31. doi: 10.1038/sj.hdy.6800301. Heredity (Edinb). 2003. PMID: 12939622
-
Edible Snail Production in Europe.Animals (Basel). 2022 Oct 11;12(20):2732. doi: 10.3390/ani12202732. Animals (Basel). 2022. PMID: 36290118 Free PMC article. Review.
-
Revisiting the comparative phylogeography of unglaciated eastern North America: 15 years of patterns and progress.Ecol Evol. 2022 Apr 19;12(4):e8827. doi: 10.1002/ece3.8827. eCollection 2022 Apr. Ecol Evol. 2022. PMID: 35475178 Free PMC article. Review.
Cited by
-
Exploring species level taxonomy and species delimitation methods in the facultatively self-fertilizing land snail genus Rumina (gastropoda: pulmonata).PLoS One. 2013;8(4):e60736. doi: 10.1371/journal.pone.0060736. Epub 2013 Apr 5. PLoS One. 2013. PMID: 23577154 Free PMC article.
-
Canine angiostrongylosis: recent advances in diagnosis, prevention, and treatment.Vet Med (Auckl). 2014 Dec 1;5:181-192. doi: 10.2147/VMRR.S53641. eCollection 2014. Vet Med (Auckl). 2014. PMID: 32670858 Free PMC article. Review.
-
Population genetic structure of the land snail Camaena cicatricosa (Stylommatophora, Camaenidae) in China inferred from mitochondrial genes and ITS2 sequences.Sci Rep. 2017 Nov 15;7(1):15590. doi: 10.1038/s41598-017-15758-y. Sci Rep. 2017. PMID: 29142227 Free PMC article.
-
Biogeographic and demographic history of the Mediterranean snakes Malpolon monspessulanus and Hemorrhois hippocrepis across the Strait of Gibraltar.BMC Ecol Evol. 2021 Nov 22;21(1):210. doi: 10.1186/s12862-021-01941-3. BMC Ecol Evol. 2021. PMID: 34809580 Free PMC article.
-
Deep genetic structure at a small spatial scale in the endangered land snail Xerocrassa montserratensis.Sci Rep. 2021 Apr 23;11(1):8855. doi: 10.1038/s41598-021-87741-7. Sci Rep. 2021. PMID: 33893328 Free PMC article.
References
-
- Avise JC, Arnold J, Ball RM, Bermingham E, Lamb T, Neigel JE, Reeb CA, Saunders NC. Intraspecific phylogeography: the mitochondrial DNA bridge between population genetics and systematics. Ann Rev Ecol Syst. 1987;18:489–522.
-
- Dawson MN, Waples RS, Bernardi G. In: Ecology of California Marine Fishes. Allen LG, Horn MH, Pondella DJ II, editor. 2004. Phylogeography; pp. 26–54.
-
- Emerson BC, Paradis E, Thebaud C. Revealing the demographic histories of species using DNA sequences. TREE. 2001;16:707–716.
-
- Avise J. Molecular Markers, Natural History and Evolution. Chapman & Hall: New York; 1994.
MeSH terms
Substances
LinkOut - more resources
Full Text Sources
Other Literature Sources
Research Materials

