

Applying unmixing to gene expression data for tumor phylogeny inference
- PMID: 20089185
- PMCID: PMC2823708
- DOI: 10.1186/1471-2105-11-42
Applying unmixing to gene expression data for tumor phylogeny inference
Abstract
Background: While in principle a seemingly infinite variety of combinations of mutations could result in tumor development, in practice it appears that most human cancers fall into a relatively small number of "sub-types," each characterized a roughly equivalent sequence of mutations by which it progresses in different patients. There is currently great interest in identifying the common sub-types and applying them to the development of diagnostics or therapeutics. Phylogenetic methods have shown great promise for inferring common patterns of tumor progression, but suffer from limits of the technologies available for assaying differences between and within tumors. One approach to tumor phylogenetics uses differences between single cells within tumors, gaining valuable information about intra-tumor heterogeneity but allowing only a few markers per cell. An alternative approach uses tissue-wide measures of whole tumors to provide a detailed picture of averaged tumor state but at the cost of losing information about intra-tumor heterogeneity.
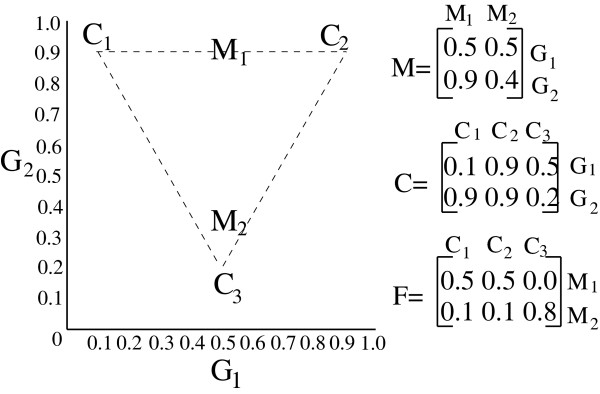
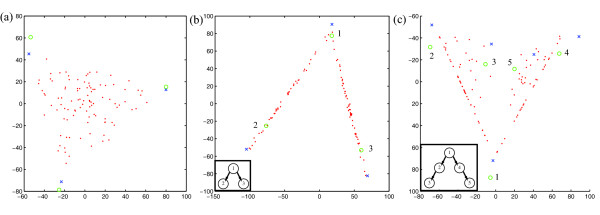
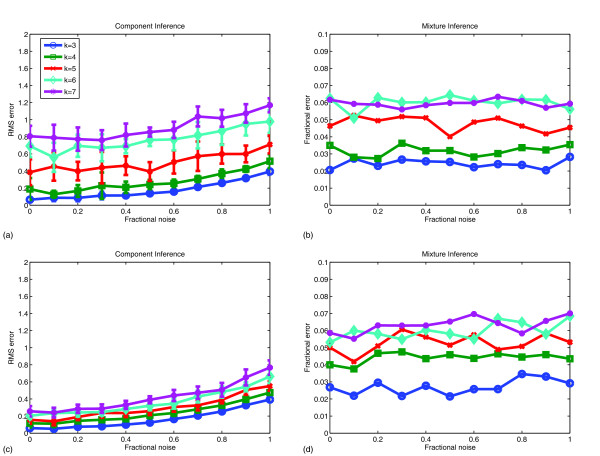
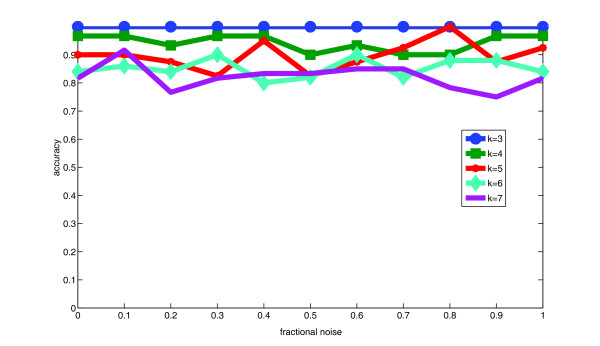
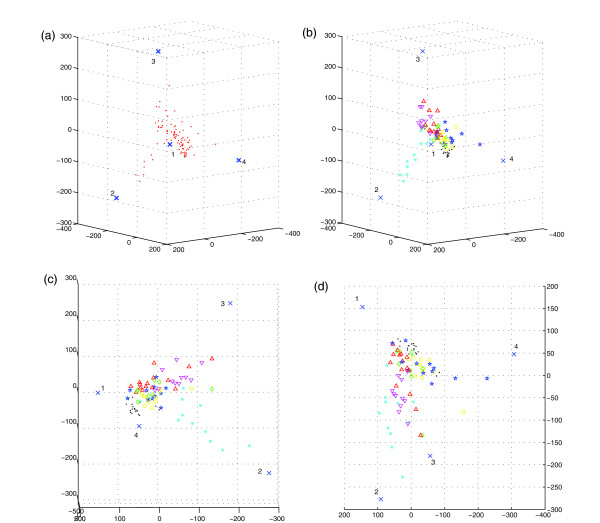
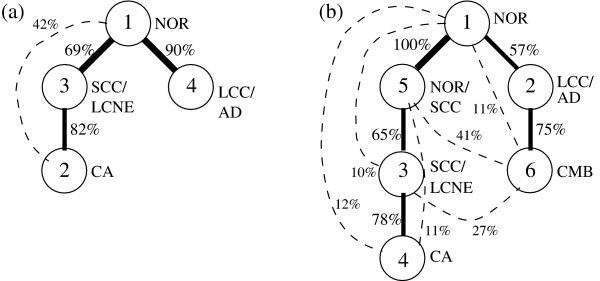
Results: The present work applies "unmixing" methods, which separate complex data sets into combinations of simpler components, to attempt to gain advantages of both tissue-wide and single-cell approaches to cancer phylogenetics. We develop an unmixing method to infer recurring cell states from microarray measurements of tumor populations and use the inferred mixtures of states in individual tumors to identify possible evolutionary relationships among tumor cells. Validation on simulated data shows the method can accurately separate small numbers of cell states and infer phylogenetic relationships among them. Application to a lung cancer dataset shows that the method can identify cell states corresponding to common lung tumor types and suggest possible evolutionary relationships among them that show good correspondence with our current understanding of lung tumor development.
Conclusions: Unmixing methods provide a way to make use of both intra-tumor heterogeneity and large probe sets for tumor phylogeny inference, establishing a new avenue towards the construction of detailed, accurate portraits of common tumor sub-types and the mechanisms by which they develop. These reconstructions are likely to have future value in discovering and diagnosing novel cancer sub-types and in identifying targets for therapeutic development.
Figures
Similar articles
-
Robust unmixing of tumor states in array comparative genomic hybridization data.Bioinformatics. 2010 Jun 15;26(12):i106-14. doi: 10.1093/bioinformatics/btq213. Bioinformatics. 2010. PMID: 20529894 Free PMC article.
-
Inference of tumor phylogenies from genomic assays on heterogeneous samples.J Biomed Biotechnol. 2012;2012:797812. doi: 10.1155/2012/797812. Epub 2012 May 13. J Biomed Biotechnol. 2012. PMID: 22654484 Free PMC article.
-
A simplicial complex-based approach to unmixing tumor progression data.BMC Bioinformatics. 2015 Aug 12;16:254. doi: 10.1186/s12859-015-0694-x. BMC Bioinformatics. 2015. PMID: 26264682 Free PMC article.
-
Computational methods for discovering gene networks from expression data.Brief Bioinform. 2009 Jul;10(4):408-23. doi: 10.1093/bib/bbp028. Brief Bioinform. 2009. PMID: 19505889 Review.
-
Molecular portraits and the family tree of cancer.Nat Genet. 2002 Dec;32 Suppl:533-40. doi: 10.1038/ng1038. Nat Genet. 2002. PMID: 12454650 Review.
Cited by
-
Reconstructing tumor clonal lineage trees incorporating single-nucleotide variants, copy number alterations and structural variations.Bioinformatics. 2022 Jun 24;38(Suppl 1):i125-i133. doi: 10.1093/bioinformatics/btac253. Bioinformatics. 2022. PMID: 35758777 Free PMC article.
-
Semi-deconvolution of bulk and single-cell RNA-seq data with application to metastatic progression in breast cancer.Bioinformatics. 2022 Jun 24;38(Suppl 1):i386-i394. doi: 10.1093/bioinformatics/btac262. Bioinformatics. 2022. PMID: 35758822 Free PMC article.
-
CTen: a web-based platform for identifying enriched cell types from heterogeneous microarray data.BMC Genomics. 2012 Sep 6;13:460. doi: 10.1186/1471-2164-13-460. BMC Genomics. 2012. PMID: 22953731 Free PMC article.
-
Archetypal analysis of diverse Pseudomonas aeruginosa transcriptomes reveals adaptation in cystic fibrosis airways.BMC Bioinformatics. 2013 Sep 23;14:279. doi: 10.1186/1471-2105-14-279. BMC Bioinformatics. 2013. PMID: 24059747 Free PMC article.
-
Neural Network Deconvolution Method for Resolving Pathway-Level Progression of Tumor Clonal Expression Programs With Application to Breast Cancer Brain Metastases.Front Physiol. 2020 Sep 4;11:1055. doi: 10.3389/fphys.2020.01055. eCollection 2020. Front Physiol. 2020. PMID: 33013452 Free PMC article.
References
-
- Golub TR, Slonim DK, Tamayo P, Huard C, Gaasenbeek M, Mesirov JP, Coller H, Loh ML, Downing JR, Caligiuri MA, Bloomfield CD, Lander ES. Molecular classification of cancer: class discovery and class prediction by gene expression monitoring. Science. 1999;286:531–537. doi: 10.1126/science.286.5439.531. - DOI - PubMed
-
- Perou CM, Sorlie T, Eisen MB, Rijn M van der, Rees SSJCA, Pollack JR, Ross DT, Johnsen H, Akslen LA, Fluge O, Pergamenschikov A, Williams C, Zhu SX, Lønning PE, Børresen-Dale AL, Brown PO, Botstein D. Molecular portraits of human breast tumors. Nature. 2000;406:747–752. doi: 10.1038/35021093. - DOI - PubMed
-
- Sorlie T, Perrou CM, Tibshirani R, Aas T, Geisler S, Johnsen H, Hastie T, Eisen MB, Rijn M van de, Jeffrey SS, Thorsen T, Quist H, Matese JC, Brown PO, Botstein D, Eystein Lønning P, Børresen-Dale AL. Gene expression profiles of breast carcinomas distinguish tumor subclasses with clinical implications. Proc Natl Acad Sci USA. 2001;98:10869–10864. doi: 10.1073/pnas.191367098. - DOI - PMC - PubMed
-
- Sorlie T, Tibshirani R, Parker J, Hastie T, Marron JS, Nobel A, Deng S, Johnsen H, Pesich R, Geisler S, Demeter J, Perou CM, Lønning PE, Brown PO, Børresen-Dale AL, Botstein D. Repeated observation of breast tumor subtypes in indepednent gene expression data sets. Proc Natl Acad Sci USA. 2003;100:8418–8423. doi: 10.1073/pnas.0932692100. - DOI - PMC - PubMed
-
- Pegram MD, Konecny G, Slamon DJ. The molecular and cellular biology of HER2/neu gene amplification/overexpression and the clinical development of herceptin (trastuzumab) therapy for breast cancer. Cancer Treat Res. 2000;103:57–75. - PubMed
Publication types
MeSH terms
Substances
Grants and funding
LinkOut - more resources
Full Text Sources
