. 2010 Jan 20:10:8.
doi: 10.1186/1471-213X-10-8.

Analysis of retinal cell development in chick embryo by immunohistochemistry and in ovo electroporation techniques

Affiliations

Analysis of retinal cell development in chick embryo by immunohistochemistry and in ovo electroporation techniques

Sung Tae Doh et al. BMC Dev Biol. .

Abstract

Background: Retinal cell development has been extensively investigated; however, the current knowledge of dynamic morphological and molecular changes is not yet complete.

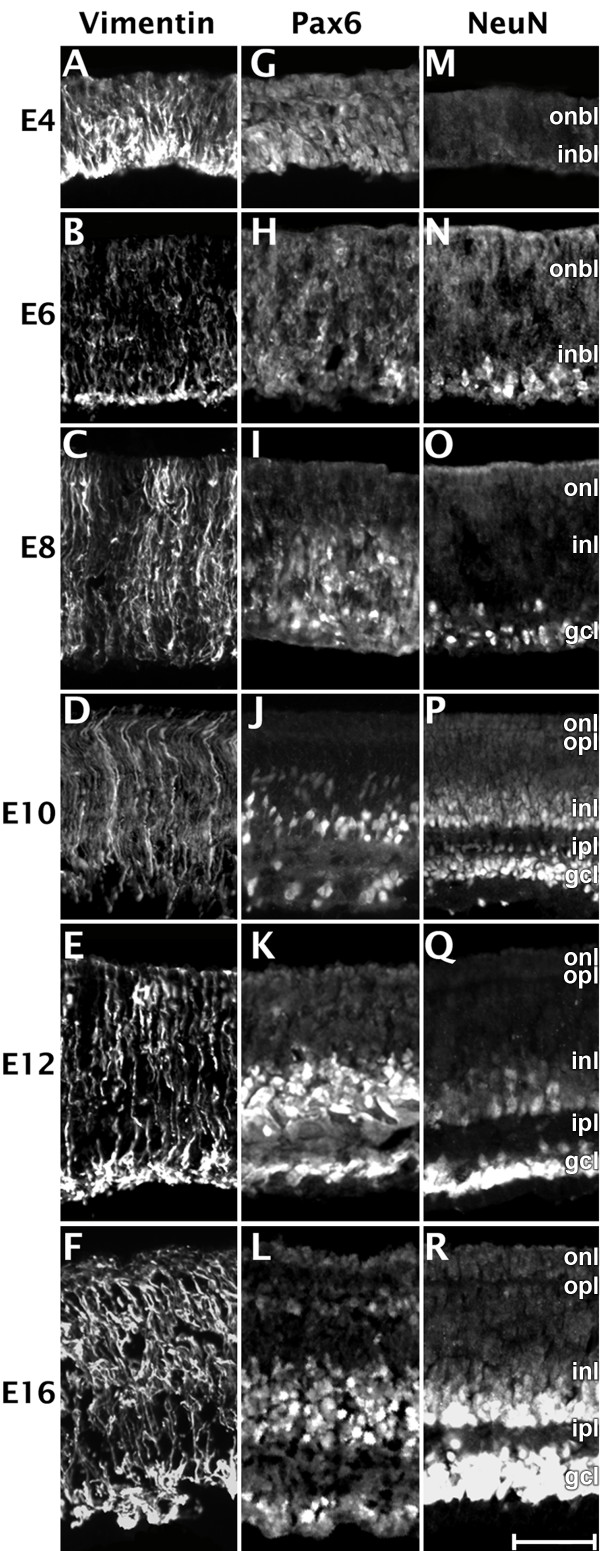
Results: This study was aimed at revealing the dynamic morphological and molecular changes in retinal cell development during the embryonic stages using a new method of targeted retinal injection, in ovo electroporation, and immunohistochemistry techniques. A plasmid DNA that expresses the green fluorescent protein (GFP) as a marker was delivered into the sub-retinal space to transfect the chick retinal stem/progenitor cells at embryonic day 3 (E3) or E4 with the aid of pulses of electric current. The transfected retinal tissues were analyzed at various stages during chick development from near the start of neurogenesis at E4 to near the end of neurogenesis at E18. The expression of GFP allowed for clear visualization of cell morphologies and retinal laminar locations for the indication of retinal cell identity. Immunohistochemistry using cell type-specific markers (e.g., Visinin, Xap-1, Lim1+2, Pkcalpha, NeuN, Pax6, Brn3a, Vimentin, etc.) allowed further confirmation of retinal cell types. The composition of retinal cell types was then determined over time by counting the number of GFP-expressing cells observed with morphological characteristics specific to the various retinal cell types.

Conclusion: The new method of retinal injection and electroporation at E3 - E4 allows the visualization of all retinal cell types, including the late-born neurons, e.g., bipolar cells at a level of single cells, which has been difficult with a conventional method with injection and electroporation at E1.5. Based on data collected from analyses of cell morphology, laminar locations in the retina, immunohistochemistry, and cell counts of GFP-expressing cells, the time-line and dynamic morphological and molecular changes of retinal cell development were determined. These data provide more complete information on retinal cell development, and they can serve as a reference for the investigations in normal retinal development and diseases.


Figures

Figure 1
Figure 1
The expression of chick retinal cell-type specific marker determined by immunohistochemistry method. Retina tissue from chicken embryos were harvested at various time points during development, sectioned, and stained with retinal cell type specific antibodies Xap-1 (A-F), Visinin (G-L), Lim1+2 (M-R), and Brn3a (S-X). Xap-1 is known to selectively stain only the outer segments of photoreceptor cells, while Visinin is known to selectively stain the entire photoreceptor cells. Lim1+2 labels horizontal cells exclusively. Brn3a selectively labels as subset of ganglion cells. By staining retinas at various times during development, the onset of each cell type specific marker and their changes through out development were observed. ONBL, outer neuroblastic layer; INBL, inner neuroblastic layer; ONL, outer nuclear layer; INL, inner nuclear layer; GCL, ganglion cell layer. Scale bar = 40 μm.
Figure 2
Figure 2
The expression of glial and neuronal specific markers in the developing retina. Retina tissue from chicken embryos were harvested at various time points during development, sectioned, and stained with antibodies Vimentin (A-F), Pax6 (G-L), and NeuN (M-R). While these markers are not cell-type specific, they label proteins that are involved in retina development. Vimentin labels radial glia in retina at early embryonic stages and Müller glia cells in retina at late embryonic stages. The Vimentin labeling resulted in the characteristic striated banding that stretched across the layers of the retina. Pax6 labels horizontal, amacrine, and ganglion cells. NeuN is a marker of early neurons and in the retina labels amacrine and ganglion cells. ONBL, outer neuroblastic layer; INBL, inner neuroblastic layer; ONL, outer nuclear layer; INL, inner nuclear layer; GCL, ganglion cell layer. Scale bar = 40 μm.
Figure 3
Figure 3
In ovo electroporation method targeting E3-E4 chicken retina. Glass capillary tubes were pulled to fabricate needles with a tip opening at 0.1 μm in diameter and a 20 mm taper (A). The needle is loaded with DNA/0.025% fast green solution. Eggs were rotated to release the embryo and the shells were sterilized by wiping with 70% ethanol then windowed using forceps (B). The trajectory of the needle approached the eye from behind the head, toward the beak, and tangent to the retina surface (C). The outermost region of the retina opposite of the main bundle of blood vessels entering the eye (arrowhead, C) was targeted for injection. Successful injection was verified by observing that the subretinal space of the eye was filled with DNA/fast green solution (D). Electroporation was performed with the negative electrode placed above the head of the embryo and deeper in the albumin than the eye. The positive electrode was placed below the spine and on the surface of the albumin (E). Electroporation using this orientation drives the DNA in the subretinal space toward the positive electrode and into the retinal progenitor cells (F). The egg was sealed and incubated until tissue harvest at desired time points. Electroporated retinal tissues were then checked for GFP expression. A wholemount image of a retina with GFP expression at E14 (G) shows axons of ganglion neurons originating in the central retina and extending to the optic nerve (ON). Approximately 1/3 of the central retina was transfected with decreasing levels of GFP expression in more peripheral regions (G, H). Using this method of electroporation at E3-4, the central region of the developing chick retina (area between the two red dotted lines in H) was consistently and stably transfected with pCAG-GFP throughout in ovo developmental stages.
Figure 4
Figure 4
Tracking development and migration of chicken embryonic retina cells using GFP labeling by in ovo electroporation technique. Chicken embryos are injected with pCAG-GFP and electroporated at embryonic day 4 (E4). GFP expression is observed during early stages of development, E7-E8 (A-B). These cells are elongated which is characteristics of cell migration. The cells span the whole width of the neural epithelial layer. In subsequent stages E9-E10 (C-D), cell layers begin to show distinct boundaries and cells begin to settle into their final layers. Cells also take on a rounder morphology and begin to extend their processes. The appearance of well defined cell type specific morphologies begins around E12 (E). Processes are more clearly visible and help to form clearly visible boundaries between layers. The clearest and most distinct and definitive cell morphologies are observed in GFP-expressing cells at E18 (F) (see Fig. 4). ONBL, outer neuroblastic layer; INBL, inner neuroblastic layer; ONL, outer nuclear layer; INL, inner nuclear layer; GCL, ganglion cell layer. Scale bar = 50 μm.
Figure 5
Figure 5
Characteristic morphology of various cell types in chicken retina at E18 with GFP labeling by in ovo electroporation technique. Expression of GFP is observed in all six cell types found in retina tissue through E18. Visualizing GFP expression at this stage shows cells localized in distinct layers and each of the cell type specific morphologies. Photoreceptors (A) have a cylindrical shape and are located in the outer nuclear layer (ONL). Horizontal cells (B) have processes located at the boundary of the inner nuclear layer (INL) and ONL with their cell bodies in the INL. Ganglion cells (C) are located in the GCL and have processes which mostly point toward the INL. Müller glial cells (D) span the entire retina with their cell bodies in the INL. Bipolar cells (E) have two distinct processes one that extends from the cell body in the INL to the ganglion cell layer (GCL) and the other to the ONL. Amacrine cells (F) have cell bodies in the INL and have processes that extent toward the GCL. OPL, outer plexiform layer; IPL, inner plexiform layer; Scale bar = 20 μm.
Figure 6
Figure 6
Determine retinal cell type of the GFP-expressing cells using immunohistochemistry method. GFP-expressing retinal tissues at three developmental stages (E10, E14, and E18) were sectioned and stained with retinal cell type specific antibodies, e.g., Xap-1 (A-C) and Visinin (D-F) for photoreceptor cells, Lim1+2 for horizontal cells (G-I), Pkcα for bipolar cells (J-L), Brn3a for ganglion cells (M-O), and Vimentin for Müller glial cells (P-R). For each set of images (A-R) the entire retina cross section is shown to allow for the laminar location to be easily visualized. The image on the right shows a merged high magnification image and a pair of separate images showing the antibody staining and GFP fluorescence. The white-boxed region is shown in higher magnification on the right. Double labeled cells are indicated by arrowheads at higher power. Staining with Xap-1 (A-C) and Visinin (D-F) confirmed the identity of GFP-expressing cells in the photoreceptor layer as cone photoreceptors. Lim1+2 labeling consistently labeled cells on the outermost region of the INL. Antibody staining with Pkcα failed to label any GFP-expressing cells at E10 (J). The Pkcα positive GFP-expressing cells were first seen at E14. Pkcα staining increased in both frequency and intensity in GFP-expressing cells at E18. Double labeled cells showed round cell bodies at both E14 and E18 and two distinct processes extending in opposite directions, characteristic of bipolar cells, were regularly observed at E18 (L, GFP). Antibody staining with Brn3a confirms that the GFP-expressing cells (arrowheads in M-O) are ganglion cells. As previously reported Brn3a does not label all ganglion cells. This was seen in E14 tissue (N) where GFP-expressing cells that show ganglion cell morphology and location but no Brn3a labeling (asterisk). Vimentin showed strong labeling at E10 (P) however failed to show double labeling with GFP. Double labeling at E14 (Q) was very rare and slightly more frequent at E18 (R). In both cases double labeling was only seen in the processes of the cells (Q-R, arrowheads).
Figure 7
Figure 7
Cellular composition at various stages during embryonic development of the chicken retina. Three retina samples were collected every other day from E10 to E18. Retinal cells expressing GFP were categorized into one of seven cell types based on retinal laminar location, cellular morphology, and molecular marker. Cell counts of each cell type were used to determine the distribution of each cell type during development of the retina. The data shows that the number of ganglion cells remained fairly consistent throughout this time period. Photoreceptors and horizontal cells have a significant increase in population while the increase is less dramatic in bipolar and amacrine cells. As expected, with the increase in other cell types the number of migratory cells decreases.

Similar articles

Cited by

References

    1. Kaneko A. Physiology of the retina. Annu Rev Neurosci. 1979;2:169–91. - PubMed
    1. Young RW. Cell differentiation in the retina of the mouse. Anat Rec. 1985;212:199–205. - PubMed
    1. Young RW. Cell proliferation during postnatal development of the retina in the mouse. Brain Res. 1985;353:229–39. - PubMed
    1. Alexiades MR, Cepko C. Quantitative analysis of proliferation and cell cycle length during development of the rat retina. Dev Dyn. 1996;205:293–307. - PubMed
    1. Gloor BP, Rokos L, Kaldarar-Pedotti S. Cell cycle time and life-span of cells in the mouse eye. Measurements during the postfetal period using repeated 3H-thymidine injections. Dev Ophthalmol. 1985;12:70–129. - PubMed

Publication types

Substances

LinkOut - more resources