

Quality of life in the five years after intensive care: a cohort study
- PMID: 20089197
- PMCID: PMC2875518
- DOI: 10.1186/cc8848
Quality of life in the five years after intensive care: a cohort study
Abstract
Introduction: Data on quality of life beyond 2 years after intensive care discharge are limited and we aimed to explore this area further. Our objective was to quantify quality of life and health utilities in the 5 years after intensive care discharge.
Methods: A prospective longitudinal cohort study in a University Hospital in the UK. Quality of life was assessed from the period before ICU admission until 5 years and quality adjusted life years calculated.
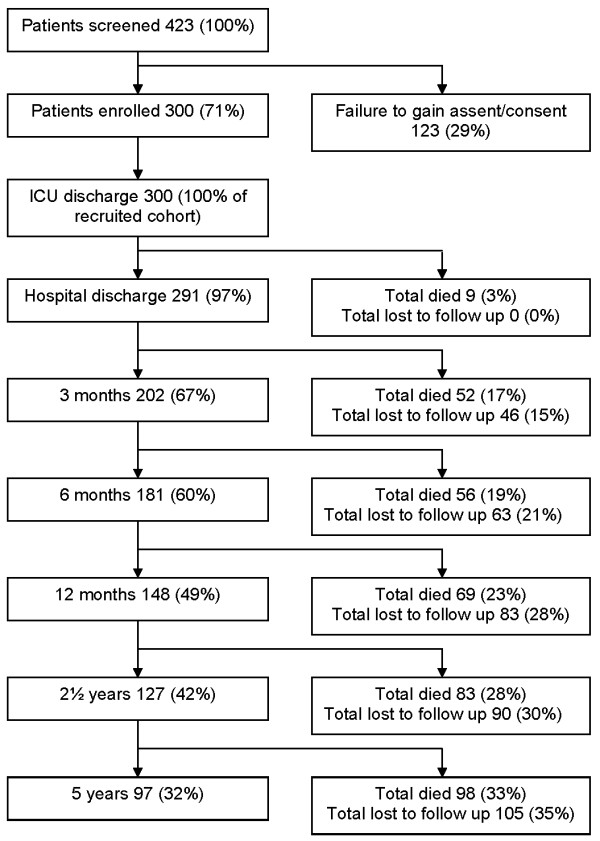
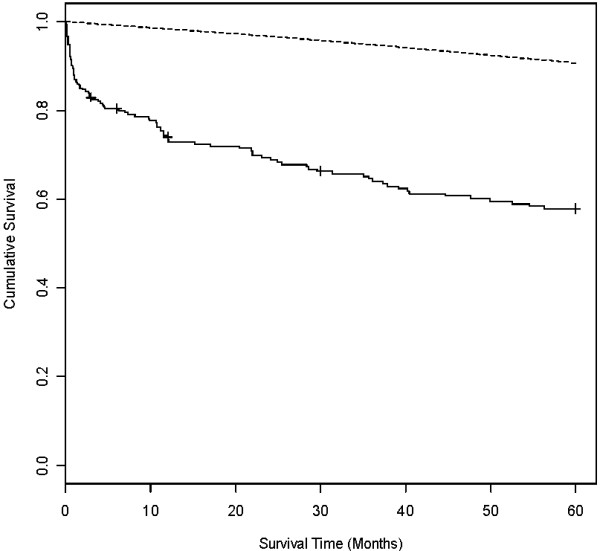
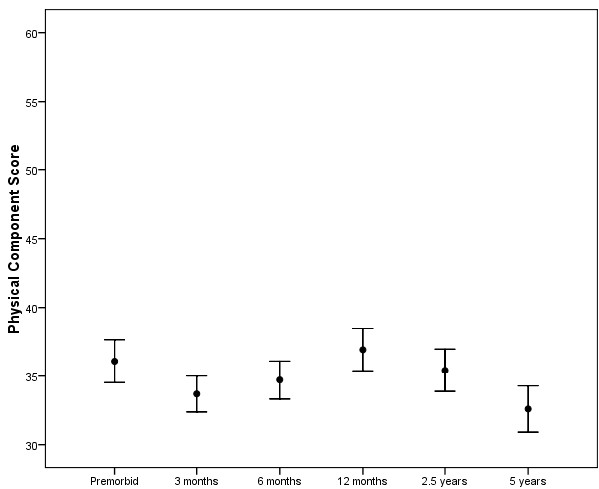
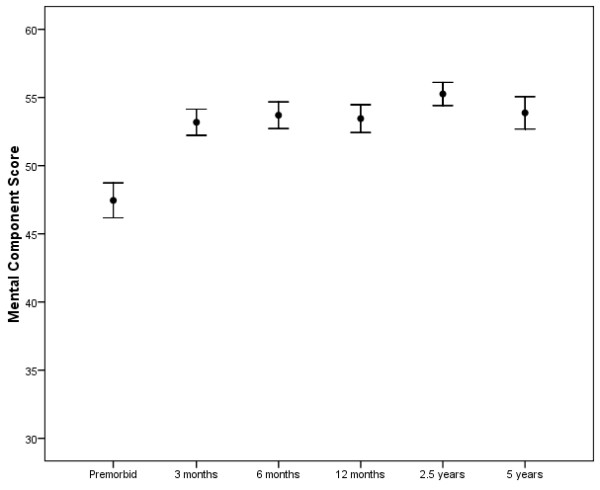
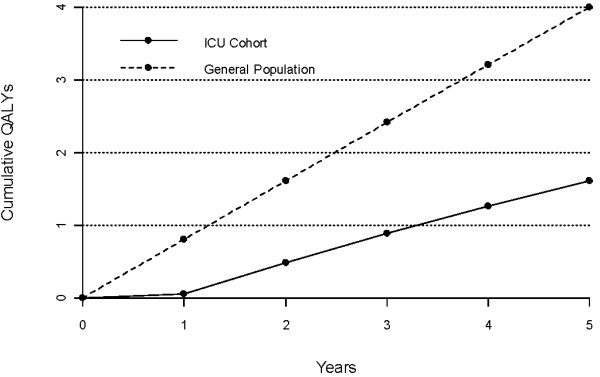
Results: 300 level 3 intensive care patients of median age 60.5 years and median length of stay 6.7 days, were recruited. Physical quality of life fell to 3 months (P = 0.003), rose back to pre-morbid levels at 12 months then fell again from 2.5 to 5 years after intensive care (P = 0.002). Mean physical scores were below the population norm at all time points but the mean mental scores after 6 months were similar to those population norms. The utility value measured using the EuroQOL-5D quality of life assessment tool (EQ-5D) at 5 years was 0.677. During the five years after intensive care unit, the cumulative quality adjusted life years were significantly lower than that expected for the general population (P < 0.001).
Conclusions: Intensive care unit admission is associated with a high mortality, a poor physical quality of life and a low quality adjusted life years gained compared to the general population for 5 years after discharge. In this group, critical illness associated with ICU admission should be treated as a life time diagnosis with associated excess mortality, morbidity and the requirement for ongoing health care support.
Figures
Comment in
-
The puzzle of long-term morbidity after critical illness.Crit Care. 2010;14(1):121. doi: 10.1186/cc8863. Epub 2010 Feb 16. Crit Care. 2010. PMID: 20236495 Free PMC article.
References
-
- Harrison DA, Brady AR, Rowan K. Case mix, outcome and length of stay for admissions to adult, general critical care units in England, Wales and Northern Ireland: the Intensive Care National Audit & Research Centre Case Mix Programme Database. Crit Care. 2004;9:S1–13. doi: 10.1186/cc3745. - DOI - PMC - PubMed
Publication types
MeSH terms
Grants and funding
LinkOut - more resources
Full Text Sources
Medical
