

Regulation of adiponectin secretion by adipocytes in the polycystic ovary syndrome: role of tumor necrosis factor-{alpha}
- PMID: 20089616
- PMCID: PMC2840865
- DOI: 10.1210/jc.2009-1158
Regulation of adiponectin secretion by adipocytes in the polycystic ovary syndrome: role of tumor necrosis factor-{alpha}
Abstract
Context: Adipose tissue dysfunction associated with low-grade chronic inflammation and dysregulation of adipokine secretion might significantly contribute to the pathogenesis of polycystic ovary syndrome (PCOS).
Objective: The objective of the study was to determine whether the effect of TNF-alpha, IL-6, monocyte chemoattractant protein-1, or coculture of adipocytes and adipose tissue macrophages (ATMs), on the secretion of adiponectin by adipocytes, differs in PCOS compared with controls.
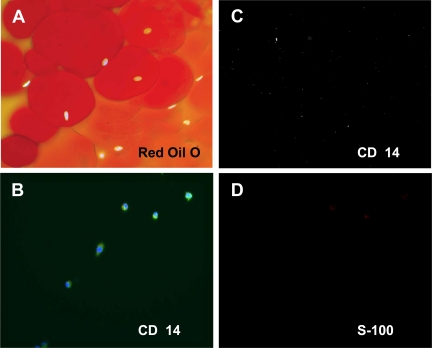
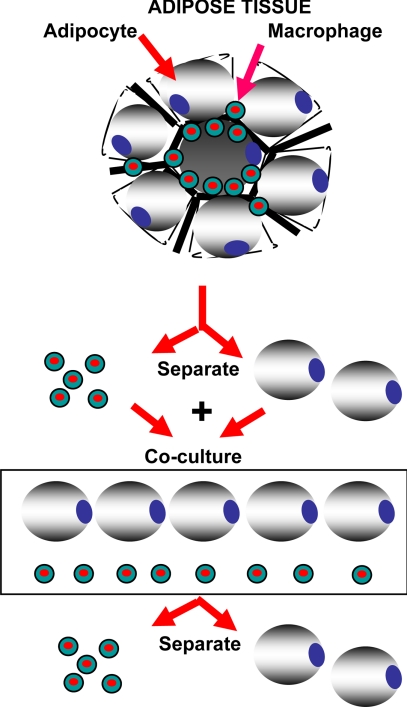
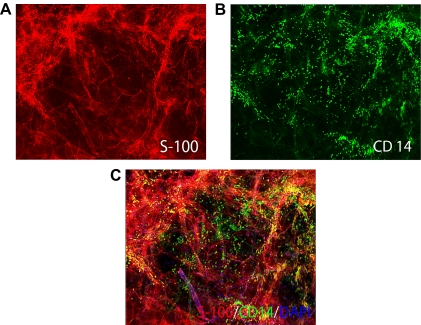
Design and participants: Primary cultures of sc adipocytes and coculture of adipocytes and ATMs from overweight and obese patients with PCOS and healthy control women were used.
Main outcome measures: Adiponectin secretion by adipocytes was measured.
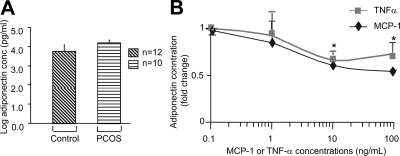
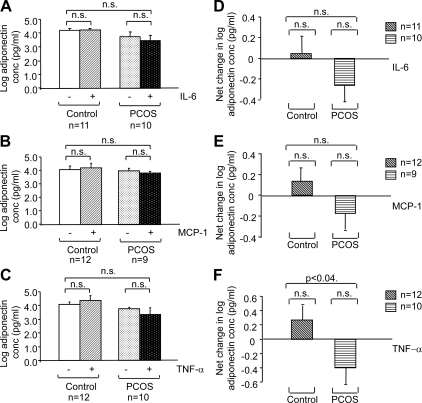
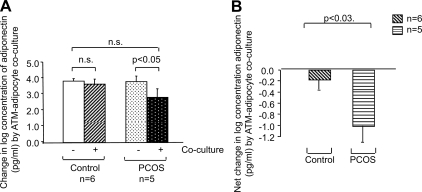
Results: The baseline secretion of adiponectin by isolated adipocytes did not differ between PCOS and control samples. The net change in adiponectin secretion in response to IL-6, monocyte chemoattractant protein-1, and TNF-alpha differed between PCOS (decreasing) and control (increasing) adipocytes, although the difference reached significance only for TNF-alpha (P < 0.04). Coculture of isolated adipocytes and ATMs resulted in a decrease in adiponectin secretion by PCOS (P < 0.05) but not control adipocytes, and the difference between the net change in adiponectin secretion in PCOS vs. control samples was significant (P < 0.03).
Conclusions: Our results suggest that adiponectin secretion by adipocytes in response to cytokines/chemokines and most notably in response to coculturing with ATMs differs between PCOS and control women, favoring greater suppression of adiponectin in PCOS. The mechanisms underlying these defects and the role of concurrent obesity remain to be determined.
Figures
Similar articles
-
Adipose expression of adipocytokines in women with polycystic ovary syndrome.Fertil Steril. 2012 Jul;98(1):235-41. doi: 10.1016/j.fertnstert.2012.03.056. Epub 2012 May 16. Fertil Steril. 2012. PMID: 22607892
-
Increased visfatin messenger ribonucleic acid and protein levels in adipose tissue and adipocytes in women with polycystic ovary syndrome: parallel increase in plasma visfatin.J Clin Endocrinol Metab. 2006 Dec;91(12):5022-8. doi: 10.1210/jc.2006-0936. Epub 2006 Sep 26. J Clin Endocrinol Metab. 2006. PMID: 17003086
-
Effect of TNF-α on Molecules Related to the Insulin Action in Endometrial Cells Exposed to Hyperandrogenic and Hyperinsulinic Conditions Characteristics of Polycystic Ovary Syndrome.Reprod Sci. 2018 Jul;25(7):1000-1009. doi: 10.1177/1933719117732157. Epub 2017 Sep 25. Reprod Sci. 2018. PMID: 28946816
-
Chronic Low Grade Inflammation in Pathogenesis of PCOS.Int J Mol Sci. 2021 Apr 6;22(7):3789. doi: 10.3390/ijms22073789. Int J Mol Sci. 2021. PMID: 33917519 Free PMC article. Review.
-
Metabolism and insulin signaling in common metabolic disorders and inherited insulin resistance.Dan Med J. 2014 Jul;61(7):B4890. Dan Med J. 2014. PMID: 25123125 Review.
Cited by
-
Editorial: Polycystic ovary syndrome (PCOS): Mechanism and management.Front Endocrinol (Lausanne). 2022 Oct 7;13:1030353. doi: 10.3389/fendo.2022.1030353. eCollection 2022. Front Endocrinol (Lausanne). 2022. PMID: 36277701 Free PMC article. No abstract available.
-
Shortened Relative Leukocyte Telomere Length Is Associated With Polycystic Ovary Syndrome and Metabolic Traits.Endocrinol Diabetes Metab. 2025 Mar;8(2):e70030. doi: 10.1002/edm2.70030. Endocrinol Diabetes Metab. 2025. PMID: 39963020 Free PMC article.
-
Ovarian hormones and obesity.Hum Reprod Update. 2017 May 1;23(3):300-321. doi: 10.1093/humupd/dmw045. Hum Reprod Update. 2017. PMID: 28333235 Free PMC article. Review.
-
Ontogeny of the ovary in polycystic ovary syndrome.Fertil Steril. 2013 Jul;100(1):23-38. doi: 10.1016/j.fertnstert.2013.02.011. Epub 2013 Mar 6. Fertil Steril. 2013. PMID: 23472949 Free PMC article. Review.
-
Drug development research for novel adiponectin receptor-targeted antidiabetic drugs contributing to healthy longevity.Diabetol Int. 2019 Sep 19;10(4):237-244. doi: 10.1007/s13340-019-00409-6. eCollection 2019 Oct. Diabetol Int. 2019. PMID: 31592400 Free PMC article. Review.
References
-
- Azziz R, Woods KS, Reyna R, Key TJ, Knochenhauer ES, Yildiz BO 2004 The prevalence and features of the polycystic ovary syndrome in an unselected population. J Clin Endocrinol Metab 89:2745–2749 - PubMed
-
- Carmina E, Koyama T, Chang L, Stanczyk FZ, Lobo RA 1992 Does ethnicity influence the prevalence of adrenal hyperandrogenism and insulin resistance in polycystic ovary syndrome? Am J Obstet Gynecol 167:1807–1812 - PubMed
-
- Dunaif A 1997 Insulin resistance and the polycystic ovary syndrome: mechanism and implications for pathogenesis. Endocr Rev 18:774–800 - PubMed
-
- Legro RS, Finegood D, Dunaif A 1998 A fasting glucose to insulin ratio is a useful measure of insulin sensitivity in women with polycystic ovary syndrome. J Clin Endocrinol Metab 83:2694–2698 - PubMed
-
- DeUgarte CM, Bartolucci AA, Azziz R 2005 Prevalence of insulin resistance in the polycystic ovary syndrome using the homeostasis model assessment. Fertil Steril 83:1454–1460 - PubMed
Publication types
MeSH terms
Substances
Grants and funding
LinkOut - more resources
Full Text Sources
Medical
Research Materials
