

Simian virus 40 infection triggers a balanced network that includes apoptotic, survival, and stress pathways
- PMID: 20089643
- PMCID: PMC2838102
- DOI: 10.1128/JVI.01735-09
Simian virus 40 infection triggers a balanced network that includes apoptotic, survival, and stress pathways
Abstract
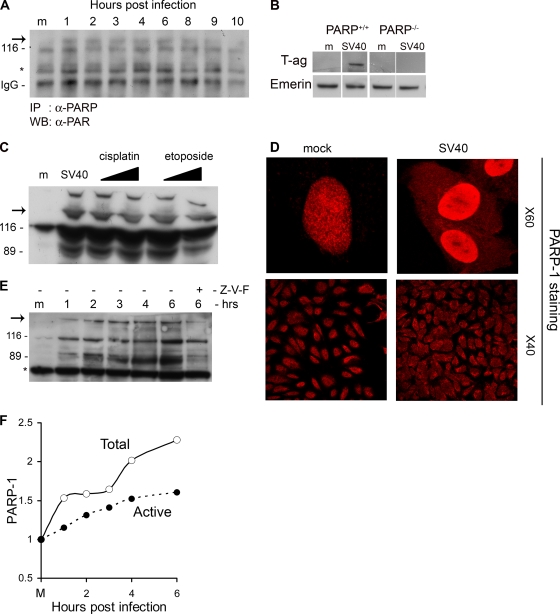
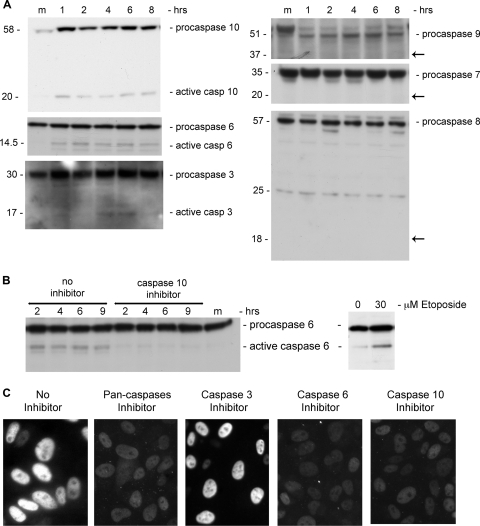
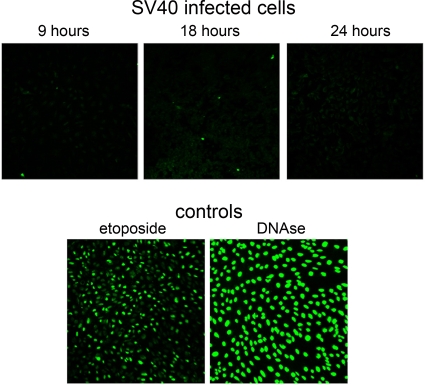
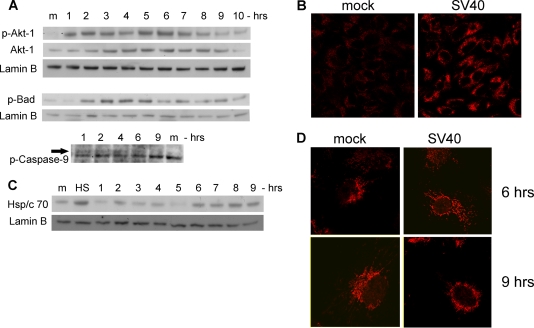
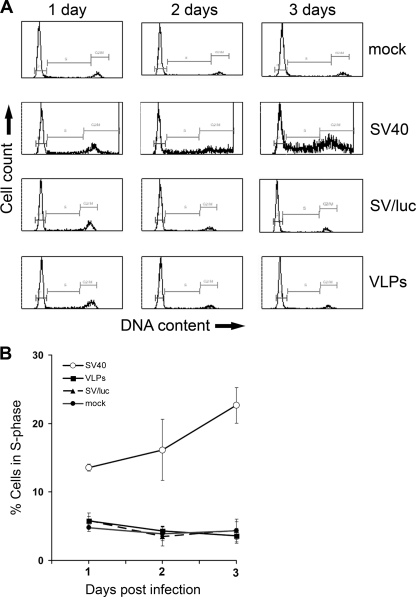
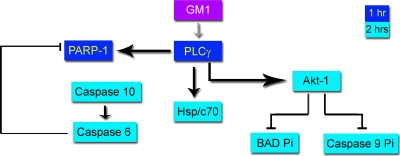
The infection process by simian virus 40 (SV40) and entry of its genome into nondividing cells are only partly understood. Infection begins by binding to GM1 receptors at the cell surface, cellular entry via caveolar invaginations, and trafficking to the endoplasmic reticulum, where the virus disassembles. To gain a deeper insight into the contribution of host functions to this process, we studied cellular signaling elicited by the infecting virus. Signaling proteins were detected by Western blotting and immunofluorescence staining. The study was assisted by a preliminary proteomic screen. The contribution of signaling proteins to the infection process was evaluated using specific inhibitors. We found that CV-1 cells respond to SV40 infection by activating poly(ADP-ribose) polymerase 1 (PARP-1)-mediated apoptotic signaling, which is arrested by the Akt-1 survival pathway and stress response. A single key regulator orchestrating the three pathways is phospholipase C-gamma (PLCgamma). The counteracting apoptotic and survival pathways are robustly balanced as the infected cells neither undergo apoptosis nor proliferate. Surprisingly, we have found that the apoptotic pathway, including activation of PARP-1 and caspases, is absolutely required for the infection to proceed. Thus, SV40 hijacks the host defense to promote its infection. Activities of PLCgamma and Akt-1 are also required, and their inhibition abrogates the infection. Notably, this signaling network is activated hours before T antigen is expressed. Experiments with recombinant empty capsids, devoid of DNA, indicated that the major capsid protein VP1 alone triggers this early signaling network. The emerging robust signaling network reflects a delicate evolutionary balance between attack and defense in the host-virus relationship.
Figures

Similar articles
-
Interaction between Simian Virus 40 Major Capsid Protein VP1 and Cell Surface Ganglioside GM1 Triggers Vacuole Formation.mBio. 2016 Mar 22;7(2):e00297. doi: 10.1128/mBio.00297-16. mBio. 2016. PMID: 27006465 Free PMC article.
-
The abundant nuclear enzyme PARP participates in the life cycle of simian virus 40 and is stimulated by minor capsid protein VP3.J Virol. 2003 Apr;77(7):4273-82. doi: 10.1128/jvi.77.7.4273-4282.2003. J Virol. 2003. PMID: 12634384 Free PMC article.
-
Rapid activation of poly(ADP-ribose) polymerase contributes to Sindbis virus and staurosporine-induced apoptotic cell death.Virology. 2002 Feb 1;293(1):164-71. doi: 10.1006/viro.2001.1253. Virology. 2002. PMID: 11853409
-
Host range analysis of simian virus 40, BK virus and chimaeric SV40/BKV: relative expression of large T-antigen and Vp1 in infected and transformed cells.Dev Biol Stand. 1998;94:191-205. Dev Biol Stand. 1998. PMID: 9776240 Review.
-
Structure and function of poly(ADP-ribose) polymerase-1: role in oxidative stress-related pathologies.Curr Vasc Pharmacol. 2005 Jul;3(3):209-14. doi: 10.2174/1570161054368625. Curr Vasc Pharmacol. 2005. PMID: 16026317 Review.
Cited by
-
Empty SV40 capsids increase survival of septic rats by eliciting numerous host signaling networks that participate in a number of systemic functions.Oncotarget. 2020 Feb 11;11(6):574-588. doi: 10.18632/oncotarget.27448. eCollection 2020 Feb 11. Oncotarget. 2020. PMID: 32110278 Free PMC article.
-
Murine Polyomavirus Cell Surface Receptors Activate Distinct Signaling Pathways Required for Infection.mBio. 2016 Nov 1;7(6):e01836-16. doi: 10.1128/mBio.01836-16. mBio. 2016. PMID: 27803182 Free PMC article.
-
Revealing in real-time a multistep assembly mechanism for SV40 virus-like particles.Sci Adv. 2020 Apr 15;6(16):eaaz1639. doi: 10.1126/sciadv.aaz1639. eCollection 2020 Apr. Sci Adv. 2020. PMID: 32494611 Free PMC article.
-
Nuclear entry of DNA viruses.Front Microbiol. 2015 May 13;6:467. doi: 10.3389/fmicb.2015.00467. eCollection 2015. Front Microbiol. 2015. PMID: 26029198 Free PMC article. Review.
-
Simian virus 40 induces lamin A/C fluctuations and nuclear envelope deformation during cell entry.Nucleus. 2011 Jul-Aug;2(4):320-30. doi: 10.4161/nucl.2.4.16371. Epub 2011 Jul 1. Nucleus. 2011. PMID: 21941111 Free PMC article.
References
-
- Ahuja, D., M. T. Saenz-Robles, and J. M. Pipas. 2005. SV40 large T antigen targets multiple cellular pathways to elicit cellular transformation. Oncogene 24:7729-7745. - PubMed
-
- Al-Molawi, N., V. A. Beardmore, M. J. Carter, G. E. Kass, and L. O. Roberts. 2003. Caspase-mediated cleavage of the feline calicivirus capsid protein. J. Gen. Virol. 84:1237-1244. - PubMed
-
- Anderson, H. A., Y. Chen, and L. C. Norkin. 1998. MHC class I molecules are enriched in caveolae but do not enter with simian virus 40. J. Gen. Virol. 79:1469-1477. - PubMed
-
- Arya, R., M. Mallik, and S. C. Lakhotia. 2007. Heat shock genes—integrating cell survival and death. J. Biosci. 32:595-610. - PubMed
-
- Ashkenazi, A. 2002. Targeting death and decoy receptors of the tumour-necrosis factor superfamily. Nat. Rev. Cancer 2:420-430. - PubMed
Publication types
MeSH terms
Substances
Grants and funding
LinkOut - more resources
Full Text Sources
Other Literature Sources
Miscellaneous
