. 2010 Apr;84(7):3666-81.
doi: 10.1128/JVI.01340-09. Epub 2010 Jan 20.

Internalization of coxsackievirus A9 is mediated by {beta}2-microglobulin, dynamin, and Arf6 but not by caveolin-1 or clathrin

Affiliations

Internalization of coxsackievirus A9 is mediated by {beta}2-microglobulin, dynamin, and Arf6 but not by caveolin-1 or clathrin

Outi Heikkilä et al. J Virol. 2010 Apr.

Abstract

Coxsackievirus A9 (CAV9) is a member of the human enterovirus B species within the Enterovirus genus of the family Picornaviridae. It has been shown to utilize alphaV integrins, particularly alphaVbeta6, as its receptors. The endocytic pathway by which CAV9 enters human cells after the initial attachment to the cell surface has so far been unknown. Here, we present a systematic study concerning the internalization mechanism of CAV9 to A549 human lung carcinoma cells. The small interfering RNA (siRNA) silencing of integrin beta6 subunit inhibited virus proliferation, confirming that alphaVbeta6 mediates the CAV9 infection. However, siRNAs against integrin-linked signaling molecules, such as Src, Fyn, RhoA, phosphatidylinositol 3-kinase, and Akt1, did not reduce CAV9 proliferation, suggesting that the internalization of the virus does not involve integrin-linked signaling events. CAV9 endocytosis was independent of clathrin or caveolin-1 but was restrained by dynasore, an inhibitor of dynamin. The RNA interference silencing of beta2-microglobulin efficiently inhibited virus infection and caused CAV9 to accumulate on the cell surface. Furthermore, CAV9 infection was found to depend on Arf6 as both silencing of this molecule by siRNA and the expression of a dominant negative construct resulted in decreased virus infection. In conclusion, the internalization of CAV9 to A549 cells follows an endocytic pathway that is dependent on integrin alphaVbeta6, beta2-microglobulin, dynamin, and Arf6 but independent of clathrin and caveolin-1.


Figures
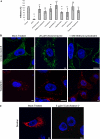
FIG. 1.
FIG. 1.
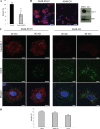
Effects of endocytosis inhibitors on CAV9 infection on A549 cells. (A) A549 cells were preincubated at 37°C for 30 min with EIPA (100 μM), chlorpromazine (25 μM), methyl-β-cyclodextrin (MβC; 1 mM), nocodazole (33.2 μM), cytochalasin D (5 μg/ml), jasplakinolide (2 μM), latrunculin A (1 μM), wortmannin (100 nM), or with a combination of nystatin (25 μg/ml) and progesterone (10 μg/ml). The cells were infected with CAV9 at 60% efficiency of infection and incubated on ice for 1 h. The unbound virus was removed, and cells were transferred to 37°C and incubated for 6 h. The inhibitors were present throughout the experiment. Cells were fixed, permeabilized, and stained with Hoechst and virus-specific antibody, and the efficiency of infection was calculated from confocal images as the ratio of infected cells to the total cell number. The experiment was performed three times, and the mean is shown. Statistical significance was calculated with a paired-sample t test, in which a P of <0.05 was considered significant. Inhibitors showing a statistically significant effect are shown with an asterisk. Effects of chlorpromazine (25 μM) and MβC (1 mM) on the internalization of cholera toxin B and transferrin (B) and of cytochalasin D (5 μg/ml) on the internalization of dextran (C) are shown. A549 cells were incubated with the inhibitors for 30 min at 37°C, after which AF 488-conjugated cholera toxin B (0.2 μg/ml), AF 546-conjugated transferrin (10 μg/ml), or AF 546-conjugated dextran (250 μg/ml) was added. The incubation was continued for 15 min, the cells were fixed and stained with Hoechst, and confocal images were taken. Cholera toxin B is shown in green, transferrin and dextran are in red, and nuclei are in blue. Bar, 10 μm.
FIG. 2.
FIG. 2.
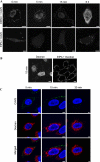
Macropinocytosis is not required for CAV9 internalization. (A) A549 cells were preincubated at 37°C for 30 min with EIPA (100 μM) or DMSO (0.4%). CAV9 was added at 60% efficiency of infection, and cells were incubated on ice for 1 h. Unbound virus was removed by washing, and cells were transferred to 37°C for incubation for different time periods (0, 5, and 15 min and 6 h). Cells were fixed, permeabilized, and stained prior to confocal imaging. In the top row, CAV9 is shown as white spots, and the nucleus is shown as a larger circle in the middle. In the lower row, only the virus is shown in white since the autofluorescence of EIPA stains the cell, making the visualization of the nucleus difficult. (B) A549 cells were preincubated with 100 μM EIPA, and dextran uptake (white) was followed for 15 min at 37°C. Cells incubated with 0.4% DMSO were used as a control. (C) The simultaneous internalization of CAV9 and dextran was studied by infecting the A549 cells with CAV9 in the presence of AF 546-conjugated dextran (250 μg/ml) and following the infection for 5, 15, and 30 min before cell fixation, permeabilization, staining, and confocal imaging. CAV9 is shown in green, dextran is in red, and nuclei are in blue. In panel C, the cells at 15 min postinfection were imaged closer to the nucleus than in panel A; thus, the virus appears near the cell surface. Bar, 10 μm.
FIG. 3.
FIG. 3.
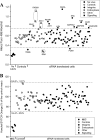
The effect of siRNA transfections on CAV9 infection on A549 cells. (A) siRNA-transfected A549 cells were cultured for 48 h and infected with CAV9 at 10% efficiency of infection. Unbound virus was removed, and cells were transferred to 37°C. After 6 h, the wells were fixed, permeabilized, and stained with CAV9-specific antibody, AF 488-labeled secondary antibody, and Hoechst. Fluorescence intensities were measured with a Victor3 multilabel counter, and the ratio of AF 488 signal to Hoechst signal was considered the measure of efficiency of infection. The experiment was performed five times, and the mean was calculated. Cutoff values were defined as positive-control mean ± 3 SDs. Noninfected cells served as negative controls; positive controls included nontransfected, mock-transfected, and scramble-transfected cells. Genes whose silencing increase or decrease the virus infection outside the cutoff values are indicated. (B) The cell viability at 48 h posttransfection was monitored by staining the cells with a mixture of Hoechst and the dead-cell stain Sytox Orange. Cells treated with 10 mM MβC were used as negative controls; nontransfected, and mock-transfected, and scramble-transfected cells were used as positive controls. Fluorescence intensities were measured with a Victor3 apparatus; the ratio of Hoechst signal to Sytox Orange signal was calculated, and the value of each sample was given as a percentage of the mean of positive controls. The experiment was done three times, and the mean was calculated. Cutoff values were defined as positive-control mean ± 2 SDs.
FIG. 4.
FIG. 4.
CAV9 is not internalized into A549 cells in association with αVβ6 integrin. A549 cells were grown on coverslips for 24 h and infected with CAV9 at 60% efficiency of infection. Unbound virus was removed, warm medium was added (0 min), and cells were transferred to 37°C. The cells were incubated for 5 or 20 min before they were fixed and permeabilized. Cells were stained with virus-specific polyclonal antiserum and AF 488-labeled secondary antibody (green) and with integrin αvβ6-specific monoclonal antibody and AF 568-labeled secondary antibody (red) prior to confocal imaging. Bar, 10 μm.
FIG. 5.
FIG. 5.
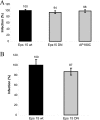
Clathrin route markers Eps15 and AP180C are not involved in CAV9 infection. (A) Plasmids expressing dominant negative constructs Eps15EΔ95/295 and AP180C were transiently transfected into A549 cells. Eps15 wild-type was used as a control. (B) A549 cells were transduced with adenovirus vectors carrying wild-type (DIIIΔ2) and a dominant negative (DIII) Eps15 gene. In both assays, cells were cultured for 48 h and infected with CAV9 at 60% efficiency of infection. After 1 h of incubation on ice, unbound virus was removed, and the cells were transferred to 37°C. The cells were incubated for 6 h before they were fixed, permeabilized, and stained with virus-specific antibody. Infection efficiency was counted from microscopic images of 300 to 500 transfected or transduced cells in three separate experiments, and the infection in control cells was set to 100%. Error bars indicate SD.
FIG. 6.
FIG. 6.
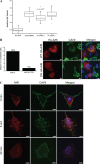
Caveolin-1 is not needed for CAV9 infection. (A) Plasmid constructs expressing wild-type and dominant negative caveolin-3 were transiently transfected to A549 cells. After 48 h, the cells were infected with CAV9 at 60% efficiency of infection, incubated on ice for 1 h, and washed. Warm medium was added, and the cells were transferred to 37°C. The cells were incubated for 6 h prior to fixation and staining. Infection efficiency was counted from microscopic images of 100 to 200 transfected cells in three separate experiments, and the infection in wild-type control cells was set to 100%. Error bar indicates SD. (B) The caveolin-1-silenced cell line A549-C9 was generated by infecting A549 cells with retrovirus vector carrying caveolin-1-silencing shRNA. The vector RVH1 was used as a control. The silencing efficiency was analyzed by confocal imaging and Western analysis. For confocal imaging, the cells were cultured for 24 h on coverslips, fixed, and permeabilized, after which caveolin-1 was stained with rabbit polyclonal antiserum and AF 546-labeled secondary antibody (red). For Western analysis, protein samples (30 μg) were separated in a 15% SDS-PAGE gel and transferred to a Hybond-P membrane. Caveolin-1-specific antibody combined to HRP-labeled secondary antibody was used for detection, and Erk1-specific antibody was used as a loading control. (C) Cell lines A549-RVH1 and A549-C9 were infected with CAV9 as above. The infection was allowed to proceed for 30 or 90 min before fixation, permeabilization, and immunostaining. CAV9 is shown in green, caveolin-1 is in red, and nuclei are in blue. Bar, 10 μm. (D) A549, A549-C9, and HuH-7 cells were infected with CAV9 as above. After 6 h of incubation at 37°C, cells were fixed, permeabilized, and stained with CAV9-specific antibody. Infection efficiency was counted from microscopic images of 100 to 200 cells, and the infection in A549 cells was set to 100%.
FIG. 7.
FIG. 7.
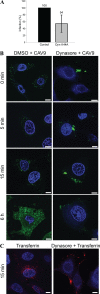
CAV9 infection is dependent on dynamin 2. (A) A549 cells transiently transfected with plasmids expressing wild-type and dominant negative (K44A) forms of dynamin-2 were infected with CAV9 at 60% efficiency of infection and incubated on ice for 1 h. Unbound virus was removed by washing, and cells were transferred to 37°C, where they were incubated for 6 h. Cells were fixed, permeabilized, and stained with CAV9-specific antibody, and confocal images were taken. Infection efficiency was counted from microscopic images of 100 to 200 transfected cells in three separate experiments, and the infection in wild-type control cells was set to 100%. Error bar indicates SD. (B) A549 cells were preincubated with 80 μM dynasore or 0.4% DMSO for 30 min before CAV9 infection. The infection was performed as above and incubated at 37°C for 0 min, 5 min, 15 min, and 6 h before fixation, permeabilization, staining with CAV9-specific antibody, and confocal imaging. Dynasore was present throughout the assay. The virus is shown in green, and nuclei are in blue. (C) To verify the function of dynasore, A549 cells were preincubated with 80 μM dynasore, and the control cells were preincubated with DMSO. AF 546-conjugated transferrin was added and incubated for 2 min at room temperature. The cells were washed with medium containing dynasore or DMSO, and the cells were incubated for 15 min at 37°C. The cell plate was then transferred onto ice, and transferrin bound to the cell surface was removed by acidic washing. The internalization of transferrin was visualized by confocal microscopy. Bar, 10 μm.
FIG. 8.
FIG. 8.
β2M is required for CAV9 infection. A549 cells were transfected with control siRNA or β2M siRNA (Hs_β2M_3) and cultured for 48 h. The cells were infected with CAV9 at 60% efficiency of infection, incubated on ice for 1 h, and washed. Warm medium was added at the 0-min time point; the cells were transferred to 37°C and incubated for 5 min, 20 min, and 6 h before fixing, permeabilization (except for the 0-min sample), staining with CAV9- and β2M-specific antibodies, and confocal imaging. CAV9 is shown in green, β2M is in red, and nuclei are in blue. A silenced cell in the 0-min images is indicated by an arrow. Bar, 10 μm.
FIG. 9.
FIG. 9.
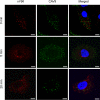
Arf6 mediates CAV9 endocytosis. (A) A549 cells transfected with negative-control siRNA and two individual Arf6 siRNAs were infected with a CAV9 at 10% efficiency of infection, incubated on ice for 1 h, and washed. Warm medium was added, and the cells were transferred to 37°C and incubated for 6 h, after which they were fixed and permeabilized. The cells were stained with CAV9-specific antibody, AF 488-labeled secondary antibody, and Hoechst. Fluorescence intensities were measured with a Victor3 multilabel counter, and the ratio of AF 488 signal to Hoechst signal was considered the measure of efficiency of infection. For each sample, 33 wells in three separate assays were analyzed. Statistical significance between control siRNA- and Hs_ARF6_5 and Hs_ARF6_7 siRNA-silenced cells was calculated with a paired-sample t test, in which a P value of <0.05 was considered significant. In the box plot, mean, median, upper and lower quartiles, upper and lower 95% values, and maximal and minimal values are indicated by square, horizontal line, box boundaries, vertical lines, and a cross, respectively. Statistically significant difference is shown with an asterisk. (B) Plasmids expressing HA-conjugated wild-type and dominant negative Arf6 were transfected into A549 cells and cultured for 48 h. The cells were infected with CAV9 at 60% efficiency of infection by a procedure described above. Cells were stained with CAV9-specific antibody combined with AF 488-labeled secondary antibody and with HA-specific antibody combined with AF 568-labeled secondary antibody and Hoechst. The efficiency of CAV9 infection was calculated by counting the proportion of infected cells in cells transfected with wt and DN Arf6 (total values of six and seven images, respectively). HA tag is shown in red, CAV9 is in green, and nuclei are in blue. (C) A549 cells were infected with CAV9 as above and incubated at 37°C for 0 min, 5 min, and 20 min prior to fixation, permeabilization (not in the 0-min sample), and staining with antibodies specific to CAV9 and Arf6 and with Hoechst. Arf6 is shown in red, CAV9 is in green, and nuclei are in blue. Bar, 10 μm.

Similar articles

Cited by

References

    1. Abraham, G., and R. J. Colonno. 1984. Many rhinovirus serotypes share the same cellular receptor. J. Virol. 51:340-345. - PMC - PubMed
    1. Benmerah, A., M. Bayrou, N. Cerf-Bensussan, and A. Dautry-Varsat. 1999. Inhibition of clathrin-coated pit assembly by an Eps15 mutant. J. Cell Sci. 112:1303-1311. - PubMed
    1. Benmerah, A., C. Lamaze, B. Begue, S. L. Schmid, A. Dautry-Varsat, and N. Cerf-Bensussan. 1998. AP-2/Eps15 interaction is required for receptor-mediated endocytosis. J. Cell Biol. 140:1055-1062. - PMC - PubMed
    1. Bergelson, J. M. 2008. New (fluorescent) light on poliovirus entry. Trends Microbiol. 16:44-47. - PMC - PubMed
    1. Berryman, S., S. Clark, P. Monaghan, and T. Jackson. 2005. Early events in integrin αvβ6-mediated cell entry of foot-and-mouth disease virus. J. Virol. 79:8519-8534. - PMC - PubMed

Publication types