. 2010 Apr;84(7):3516-27.
doi: 10.1128/JVI.02651-09. Epub 2010 Jan 20.

Virological synapse-mediated spread of human immunodeficiency virus type 1 between T cells is sensitive to entry inhibition

Affiliations

Virological synapse-mediated spread of human immunodeficiency virus type 1 between T cells is sensitive to entry inhibition

Nicola Martin et al. J Virol. 2010 Apr.

Abstract

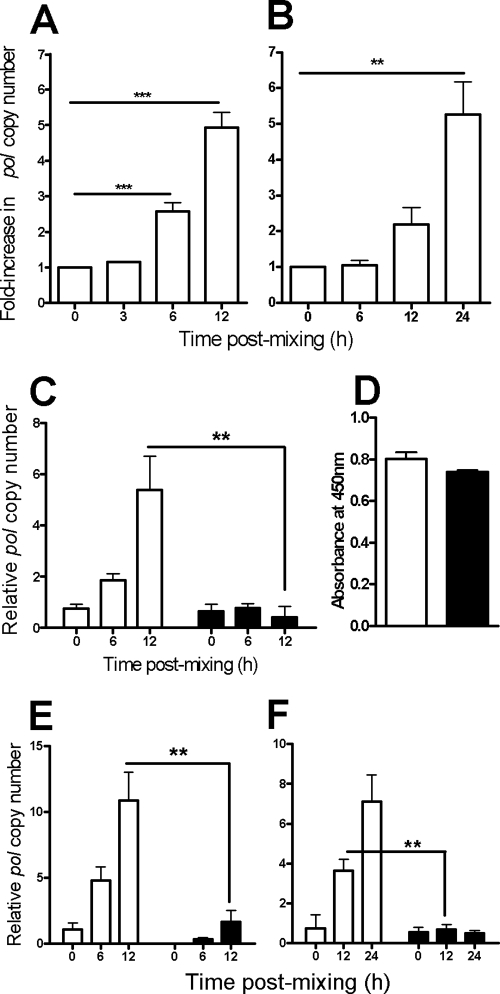
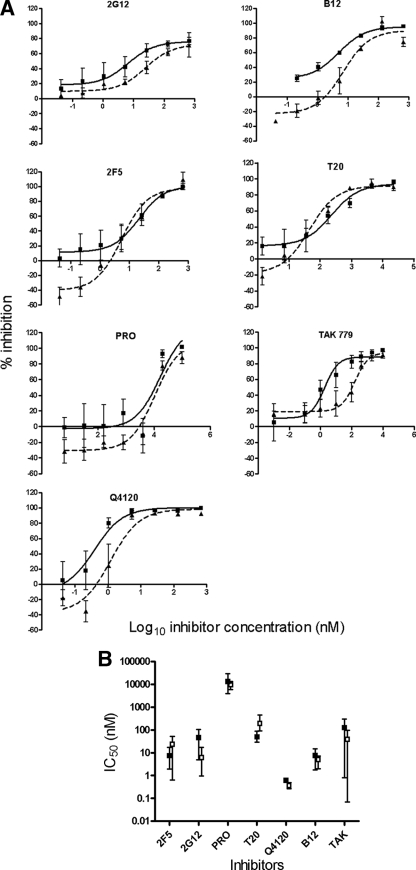
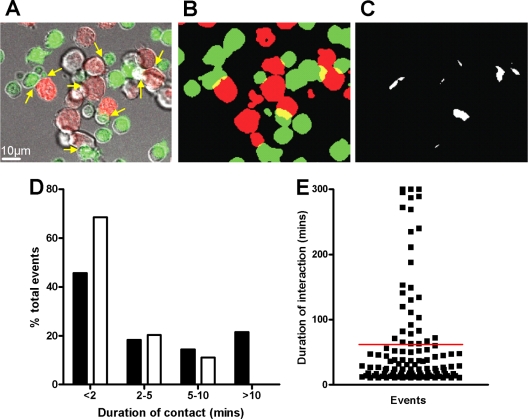
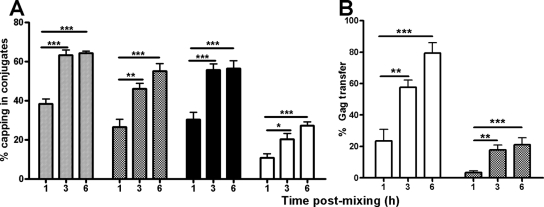
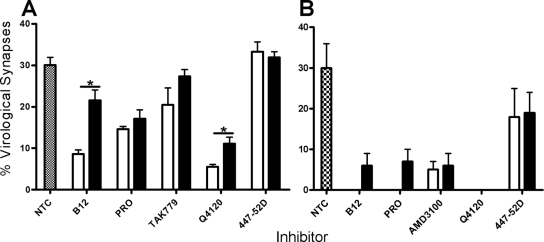
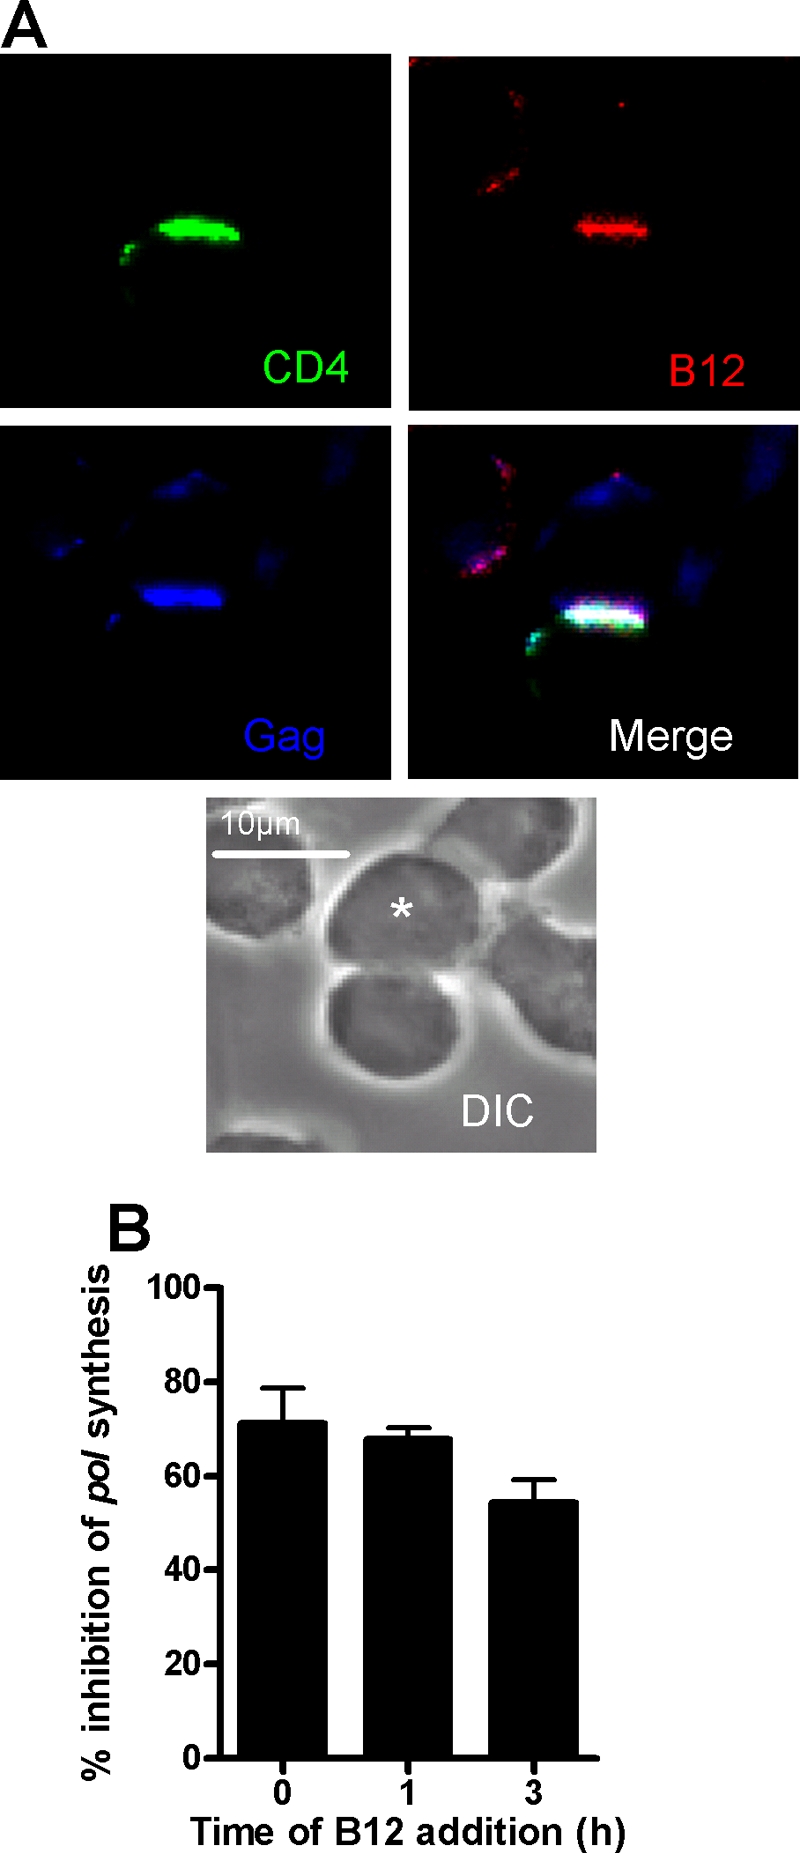
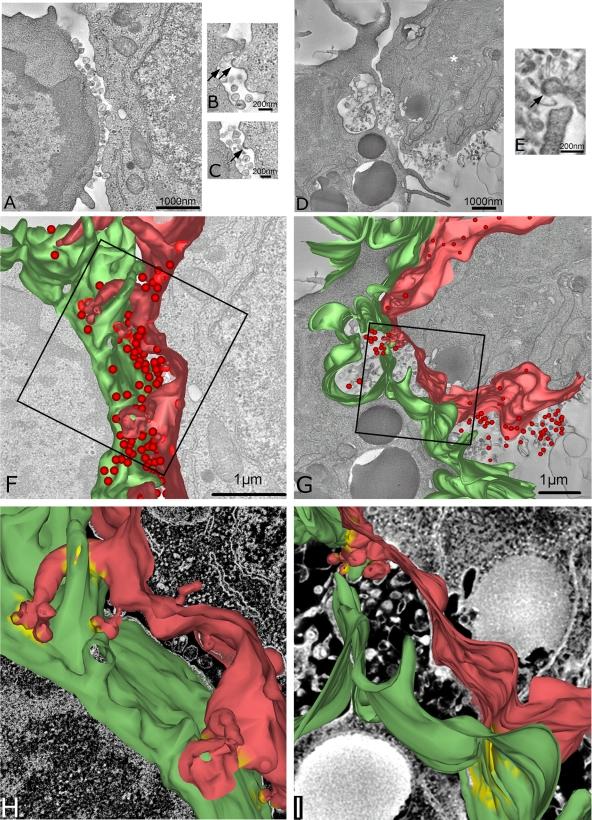
Human immunodeficiency virus type 1 (HIV-1) can disseminate between CD4(+) T cells via diffusion-limited cell-free viral spread or by directed cell-cell transfer using virally induced structures termed virological synapses. Although T-cell virological synapses have been well characterized, it is unclear whether this mode of viral spread is susceptible to inhibition by neutralizing antibodies and entry inhibitors. We show here that both cell-cell and cell-free viral spread are equivalently sensitive to entry inhibition. Fluorescence imaging analysis measuring virological synapse lifetimes and inhibitor time-of-addition studies implied that inhibitors can access preformed virological synapses and interfere with HIV-1 cell-cell infection. This concept was supported by electron tomography that revealed the T-cell virological synapse to be a relatively permeable structure. Virological synapse-mediated HIV-1 spread is thus efficient but is not an immune or entry inhibitor evasion mechanism, a result that is encouraging for vaccine and drug design.


Figures

FIG. 1.
FIG. 1.
R5 HIV-1 spreads more efficiently cell-cell than by cell-free virion diffusion. (A) HIV-1BaL transfer between infected and uninfected T-cell lines. JktBaL was mixed with A301.R5 target cells and, at the time points indicated, the samples were lysed and analyzed for HIV-1 pol by qPCR and then normalized against cellular β-globin. The background signal obtained from nonpermissive A201 cells was subtracted from all values before calculation of percent inhibition compared to no-treatment or no-virus controls. (B) HIV-1 transfer from primary CD4BaL cells to autologous activated primary CD4+ T cells, assayed by qPCR and presented as in panel A over 24 h. The data represent means of eight independent experiments, each carried out in triplicate. (C) JktBaL cells were mixed directly with A301.R5 target cells in a transwell chamber without membrane (□) or were separated by the transwell membrane (▪). At the times shown cultures were lysed and processed for qPCR. The data represent the mean pol copy number relative to β-globin from three independent experiments, each carried out in triplicate. (D) Supernatant was harvested from the lower (containing A301.R5 target cells) chamber of a transwell without (□) or with (▪) a transwell membrane to separate the top well (containing JktBal cells) and assayed for p24 Gag by ELISA. Triplicate wells were sampled from one representative experiment and the bars represent the mean + 1 standard deviation (SD). (E) JktBaL (white bars) or cell-free supernatants harvested from JktBaL cells over a 12-h culture (▪) were mixed with A301.R5 target cells at T = 0. Samples were processed as in panel A, and the data represent the mean pol copy number relative to β-globin from three independent experiments each carried out in triplicate. (F) JktBaL cells were mixed with A301.R5 target cells at T = 0, after which the cultures were either left static (□) or were agitated to prevent stable cell-cell contacts from forming (▪). Samples were processed as in panel A, and the data represent the mean pol copy number relative to β-globin from three independent experiments, each carried out in triplicate. Error bars represent the SEM. *, P < 0.05; **, P < 0.01; ***, P < 0.001.
FIG. 2.
FIG. 2.
Cell-free and cell-cell infections are equally susceptible to entry inhibition. (A) A301.R5 target cells were either mixed 1:1 with JktBaL cells or with 12-h cell-free supernatants derived from JktBaL in the presence of titrations of the inhibitors shown. Cells were harvested after 12 h and processed for qPCR of pol and β-globin. Reduction in the pol PCR signal relative to the β-globin signal was expressed for each dilution of each inhibitor. The background signal obtained from nonpermissive A201 cells was subtracted from all of the values before calculation of the percent inhibition compared to no-treatment or no-virus controls. Solid lines represent cell-free virus inhibition, and dashed lines represent cell-cell virus inhibition. (B) Percentage inhibition data from three independent experiments each carried out in triplicate were used to calculate IC50s. □, Cell-free infection inhibition; ▪, cell-cell infection inhibition. Error bars represent the SEM.
FIG. 3.
FIG. 3.
Life span of the R5 HIV-1 VS. (A) JktBaL cells prestained with CTO (red) and activated primary CD4+ T cells prestained with CFSE (green) were mixed in a 1:1 ratio and seeded onto MatTek poly-d-lysine-coated glass-bottom tissue culture dishes. Cells were imaged by time-lapse LSCM, with one frame acquired every 30 s for 250 min. A representative frame is shown with red, green, and differential interference contrast merged, with cell-cell interactions indicated by yellow arrows. (B) Same two-color image as in panel A after setting the threshold, binarizing the green and red images, and dilating the individual cell profiles as described in Materials and Methods. Cell-cell interaction sites are visible as yellow crescents. (C) The interactions are isolated in x-y two-dimensional frames as discrete white regions. Individual x-y frames were stacked together into a three-dimensional box, allowing tracking of the individual events over time. (D) The test and control series were processed as described in Materials and Methods to give the duration of each cell contact, which were grouped into the temporal categories. (E) The events falling into the >10-min category for the test movie are depicted as individual points, with the red line representing the mean duration in min.
FIG. 4.
FIG. 4.
Assembly dynamics of the R5 HIV-1 VS. (A) A301.R5 target cells prelabeled with the nonblocking CD4 MAb L120 were mixed with JktBaL cells for the times shown before fixing, permeabilizing, and labeling with the appropriate secondary reagent for CD4 (░⃞) or with the appropriate primary and secondary reagents for Gag (▩) or Env (▪). Labeling and colocalization of all three markers in the same samples was also carried out (□). The data represent the combined percentage values from multiple conjugates counted in randomly selected low-power fields, and error bars represent + 1 SD. *, P < 0.05. (B) Same as in panel A but the percentage of VS in which Gag was observed independently of Env in the target cell was divided by the number of VS (□) or by the total number of conjugate interfaces (▩).
FIG. 5.
FIG. 5.
Time of inhibitor addition effects on VS formation. (A) Target A301.R5 cells prelabeled with the nonblocking CD4 MAb L120 were mixed 1:1 with JktBaL and inhibitor was either added simultaneously (white bars) or after 1 h of cell coculture (black bars). The hatched bars represent VS assembly in the absence of inhibitor (Non-Treated Control, NTC). Cells were cultured for a total of 3 h before fixing, permeabilizing and labeling for Gag and Env. Randomly selected conjugate interfaces were analyzed for colocalization of the three markers defined as VS, as described for Fig. 4. The data are means of values from three independent experiments each carried out in triplicate, and error bars represent SEM. (B) As for (A) except that the infected cells were JktIIIB. P < 0.05.
FIG. 6.
FIG. 6.
Effects of NMAb B12 on HIV-1 infection across VS. (A) Target A301.R5 cells prelabeled with the nonblocking CD4-specific MAb L120 were mixed with JktBaL cells and cocultured on poly-l-lysine-coated coverslips. After 1 h of coculture, B12 was gently added to yield a final concentration of 10 μg/ml. The cells were cocultured for a further 2 h and then fixed, permeabilized, and labeled for B12 with anti-human IgG-TRITC and for Gag with anti-p24 antiserum, and Gag and CD4 were labeled with the appropriate secondary detection reagents. Coverslips were mounted and analyzed by LSCM. The asterisk labels the infected cell. (B) Target A301.R5 cells were mixed 1:1 with JktBal cells in the presence of 10 μg of B12/ml (T = 0), or the same concentration of B12 was added 1 h or 3 h after cell mixing. Cells were then cultured for a total of 12 h prior to lysis and qPCR for pol and β-globin products. The results are expressed as the percent inhibition of relative pol synthesis compared to no inhibitor or mixtures of JktBaL cells with the nonpermissive A201 target cell control. Each bar represents the mean data from three independent experiments carried out in triplicate, and error bars represent the SEM.
FIG. 7.
FIG. 7.
Electron tomographic reconstruction of the HIV-1 T-cell VS. (A) A single 2-nm-thick digital slice from a tomographic reconstruction of a conjugate between a primary CD4+ T cell (left) and a JktIIIB cell (right) cocultured at a 1:1 ratio for 3 h. (B) Single higher-magnification 5-nm-thick digital slice from a tomographic reconstruction of a conjugate between a primary CD4+ T-cell (left) and a JktBaL cell (right). Arrows indicate viral budding structures on the infected cell; the white asterisk indicates the nucleus of an infected cell. (C) Another single digital slice at a different z height within the same tomogram as in panel A. Arrows indicate budding structures. (D) Same as in panel A but an image from a conjugate between a JktBaL cell and a primary CD4+ T cell. (E) A higher-magnification image represents a diagonal slice through the three-dimensional volume for better visualization of the budding structure (arrow) on the surface of the JktBaL cell. (F) Three-dimensional model of the JktIIIB cell surface (red), the primary CD4+ T-cell surface (green), and virions (red spheres), generated from the same tomogram as in panel A. (G) Three-dimensional model of the JktBaL cell surface (red), the primary CD4+ T-cell surface (green), and virions (red spheres), generated from the same tomogram as in panel D. (H) Higher-power representation of cell membranes shown in the boxed area of panel F. Yellow membrane patches indicate areas of close apposition (<30 nm) of the two membranes. (I) Higher-power representation of cell membranes shown in the boxed area of panel G; the yellow label is as described in panel H.

References

    1. Baba, M., O. Nishimura, N. Kanzaki, M. Okamoto, H. Sawada, Y. Iizawa, M. Shiraishi, Y. Aramaki, K. Okonogi, Y. Ogawa, K. Meguro, and M. Fujino. 1999. A small-molecule, nonpeptide CCR5 antagonist with highly potent and selective anti-HIV-1 activity. Proc. Natl. Acad. Sci. U. S. A. 96:5698-5703. - PMC - PubMed
    1. Blanco, J., B. Bosch, M. T. Fernandez-Figueras, J. Barretina, B. Clotet, and J. A. Este. 2004. High level of coreceptor-independent HIV transfer induced by contacts between primary CD4 T cells. J. Biol. Chem. 279:51305-51314. - PubMed
    1. Bosch, B., J. Blanco, E. Pauls, I. Clotet-Codina, M. Armand-Ugon, B. Grigorov, D. Muriaux, B. Clotet, J. L. Darlix, and J. A. Este. 2005. Inhibition of coreceptor-independent cell-to-cell human immunodeficiency virus type 1 transmission by a CD4-immunoglobulin G2 fusion protein. Antimicrob. Agents Chemother. 49:4296-4304. - PMC - PubMed
    1. Bosch, B., B. Grigorov, J. Senserrich, B. Clotet, J. L. Darlix, D. Muriaux, and J. A. Este. 2008. A clathrin-dynamin-dependent endocytic pathway for the uptake of HIV-1 by direct T cell-T cell transmission. Antivir. Res. 80:185-193. - PubMed
    1. Burton, D. R., J. Pyati, R. Koduri, S. J. Sharp, G. B. Thornton, P. W. Parren, L. S. Sawyer, R. M. Hendry, N. Dunlop, P. L. Nara, et al. 1994. Efficient neutralization of primary isolates of HIV-1 by a recombinant human monoclonal antibody. Science 266:1024-1027. - PubMed

Publication types