. 2010 Mar;152(3):1514-28.
doi: 10.1104/pp.109.152579. Epub 2010 Jan 20.

Regulation of plant glycine decarboxylase by s-nitrosylation and glutathionylation

Affiliations

Regulation of plant glycine decarboxylase by s-nitrosylation and glutathionylation

M Cristina Palmieri et al. Plant Physiol. 2010 Mar.

Abstract

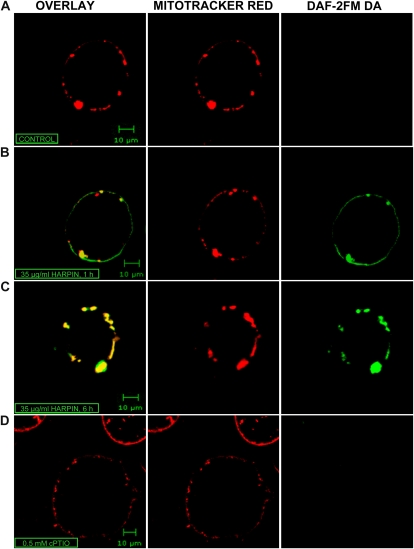
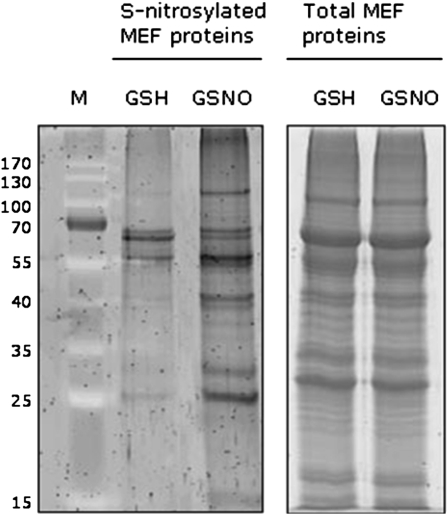
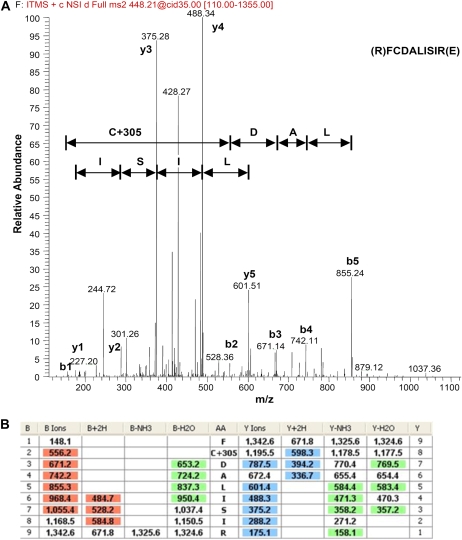
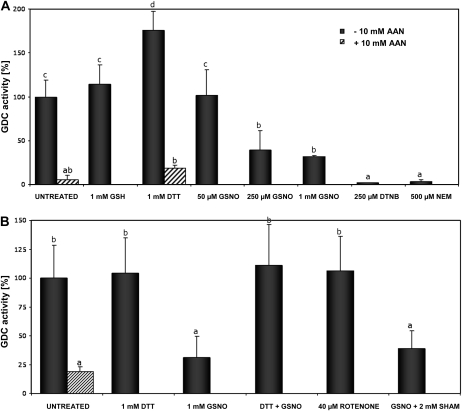
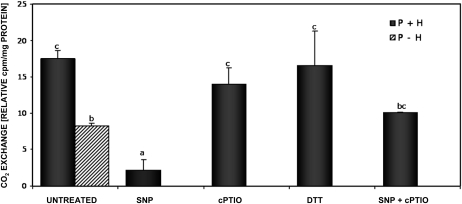
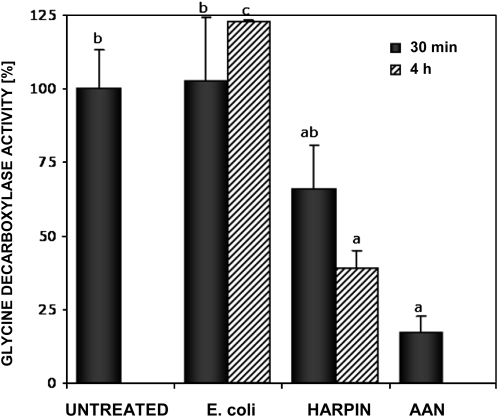
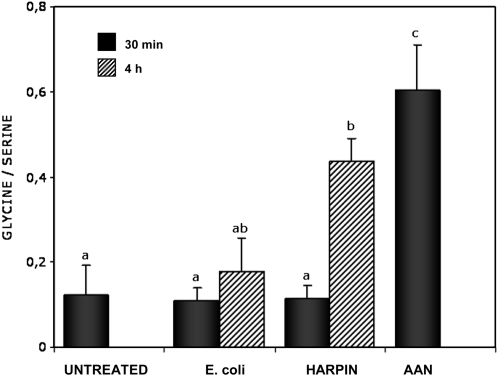
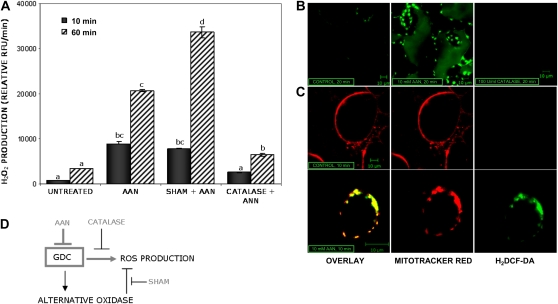
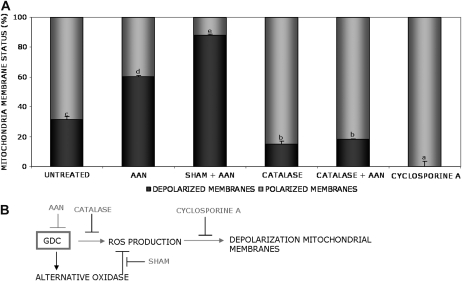
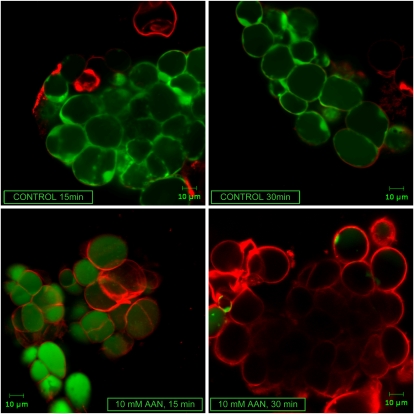
Mitochondria play an essential role in nitric oxide (NO) signal transduction in plants. Using the biotin-switch method in conjunction with nano-liquid chromatography and mass spectrometry, we identified 11 candidate proteins that were S-nitrosylated and/or glutathionylated in mitochondria of Arabidopsis (Arabidopsis thaliana) leaves. These included glycine decarboxylase complex (GDC), a key enzyme of the photorespiratory C(2) cycle in C3 plants. GDC activity was inhibited by S-nitrosoglutathione due to S-nitrosylation/S-glutathionylation of several cysteine residues. Gas-exchange measurements demonstrated that the bacterial elicitor harpin, a strong inducer of reactive oxygen species and NO, inhibits GDC activity. Furthermore, an inhibitor of GDC, aminoacetonitrile, was able to mimic mitochondrial depolarization, hydrogen peroxide production, and cell death in response to stress or harpin treatment of cultured Arabidopsis cells. These findings indicate that the mitochondrial photorespiratory system is involved in the regulation of NO signal transduction in Arabidopsis.


Figures

Figure 1.
Figure 1.
Harpin-dependent NO production in mitochondria. Arabidopsis cell cultures were treated either with extracts of nontransformed E. coli (A) or with 35 μ g mL−1 recombinant partially purified harpin (B–D). Thirty minutes before microscopic analysis, cells were incubated with MitoTracker Red 580 as a mitochondria-specific dye (red fluorescence, center column) and DAF-2FM DA as an NO probe (green fluorescence, right column) and analyzed using a fluorescence confocal microscope (Zeiss LSM 510 NLO; 40 × water lens). For NO scavenging, cells were incubated with 0.5 mm cPTIO 20 min before application of the NO probe. Colocalization of both fluorescent signals appears yellow (left column). A, Cells treated with extracts of nontransformed E. coli. The images were taken 6 h after treatment. B and C, Cells were treated with recombinant harpin. The images were taken 1 h (B) and 6 h (C) after treatment. D, Cells were treated with recombinant harpin followed by incubation with 0.5 mm cPTIO and DAF-2FM DA. The images were taken 6 h after treatment. NO fluorescence was completely scavenged by the cPTIO preincubation.
Figure 2.
Figure 2.
Detection of S-nitrosylated proteins in Arabidopsis mitochondria. Fifteen milligrams of protein of mitochondria-enriched fractions (MEF) was treated with 1 mm GSNO or GSH and labeled with biotin according to the biotin-switch method. Proteins were purified by affinity chromatography using neutravidin-agarose beads. A part of eluates was separated by 12% SDS-PAGE and visualized by SYPRO Ruby staining. Protein bands corresponding to predominant bands of the immunoblot analysis were identified by nanoLC/MS/MS. Additionally, to compare the amount of proteins in the different treatments, aliquots of mitochondria-enriched fractions were separated by SDS-PAGE (right gel). The relative masses of protein standards (M) are shown on the left (kD). The experiment was repeated three times with similar results.
Figure 3.
Figure 3.
Mass spectrometric analyses of partially purified GSNO-treated P protein. For mass spectrometric analyses, partially purified P protein was digested with trypsin at 37°C for 1 h, pH 6.5. Digested proteins were analyzed by nanoLC/MS/MS, with an automatic switch between MS, MS2, and MS3 acquisition. A, The S-glutathionylation was detected in the MS2 as a gain of 305 kD in mass. The spectra represent the MS3 fragmentation of the peptide FCDALISIR containing the glutathionylated C943. The spectrum is characterized by y-ion (y1–y5) and b-ion (b1–b5) series and shows that C943 was modified with GSH, as indicated by the presence of a b2-ion at m/z 556.2 (mass shift +305 D). B, Sequencing table showing the shift of C943. The table details peptide fragments (AA, amino acids; B, b-ions having the charge retained on the N-terminal fragment; Y, y-ions having the charge retained on the C-terminal fragment), b-ions and y-ions (single and double charged), and the neutral losses of ammonia and water for b-ions and y-ions.
Figure 4.
Figure 4.
Modulation of Gly decarboxylase activity by thiol-modifying agents. A, Mitochondria-enriched fractions were preincubated with the indicated amounts of GSNO or SH-modifying agents for 20 min at room temperature in the dark, and enzyme activity was determined subsequently. The activity of the control (untreated) was set to 100%. B, Leaf slices were treated for 20 min with GSNO, rotenone, or SHAM at room temperature after equilibration in a MOPS buffer for 1 h at 30°C. For restoring GDC activity, 1 mm DTT was added to the inhibited enzymes and incubated for an additional 10 min. Treatment with the GDC inhibitor AAN (10 mm) served as a control. The activity of controls (untreated) was set to 100%. Presented data are means ± sd of three independent experiments. Different letters indicate values statistically different based on a one-way ANOVA followed by Tukey's honestly significant difference posthoc test (A, F = 22.46, df = 9, P < 0.01; B, F = 6.16, df = 4, P < 0.01).
Figure 5.
Figure 5.
CO2-exchange reaction modulated by NO. The activity of P protein was determined by measuring the amounts of [14C]bicarbonate fixed to the carboxyl group carbon atom of Gly in the presence of a saturating amount of H protein. Proteins were treated with 1 mm DTT, 250 μm SNP, and/or 500 μm cPTIO for 10 min, and the activity was measured 30 min after the addition of bicarbonate. As a source of H protein, 100 μ g of proteins of the light fraction from size-exclusion chromatography was used. P protein derived by chromatography, 30 μ g; black bars, H + P proteins; striped bar, P protein alone. Each value represents the mean of at least three technical replicates. Different letters indicate values statistically different based on a one-way ANOVA followed by Tukey's honestly significant difference posthoc test (F = 12.8, df = 5, P < 0.01).
Figure 6.
Figure 6.
Modulation of Gly decarboxylase activity by harpin. Leaf slices were treated with 35 μ g mL−1 recombinant harpin or with an extract of nontransformed E. coli at room temperature after equilibration in MOPS buffer for 1 h at 30°C. Treatment with the GDC inhibitor AAN was used as a control. The Gly decarboxylase activity in untreated control was set to 100%. Data shown are means ± sd of three independent experiments. Different letters indicate values statistically different based on a one-way ANOVA followed by Tukey's honestly significant difference posthoc test (F = 7.8, df = 5, P < 0.01).
Figure 7.
Figure 7.
Determination of Gly-Ser ratio to monitor GDC inhibition. The inhibition of the activity of the GDC was monitored following the increase in Gly content and decrease in Ser content in Arabidopsis leaves. Amino acid content analysis was performed using 100 mg of fresh tissue and a HPLC system. Each value represents the ratio between Gly and Ser (μ mol g−1 fresh weight). Leaves were treated for the indicated times with extracts of nontransformed E. coli or recombinant harpin (35 μ g mL−1). The GDC inhibitor AAN was used as a control. Experiments were repeated three times with similar results. Different letters indicate values statistically different based on a one-way ANOVA followed by Tukey's honestly significant difference posthoc test (F = 8.5, df = 5, P < 0.01).
Figure 8.
Figure 8.
AAN-dependent ROS production in cultured cells and leaves of Arabidopsis. A, AAN, an inhibitor of the GDC, was used to study the effect of GDC inhibition in cultured cells of Arabidopsis. The ROS-dependent fluorescence of the H2DCF-DA dye was monitored with a Tecan GENios fluorescence plate reader. Catalase was used to scavenge H2O2 production in the assay, and its relative fluorescence unit (RFU) value, corresponding to the dye background, was subtracted from other samples. SHAM, 2 mm; catalase, 100 units mL−1; AAN, 10 mm. Data shown are means ± sd of three independent experiments. Different letters indicate values statistically different based on a one-way ANOVA followed by Tukey's honestly significant difference posthoc test (F = 166.2, df = 7, P < 0.01). B, Arabidopsis leaf slices were incubated with 10 μm ROS-sensitive dye (H2DCF-DA). After 20 min, the leaf slices were treated with 10 mm AAN for 20 min (middle) or buffer (control; left). Produced H2O2 was scavenged by preincubation with 100 units mL−1 catalase (right). Confocal microscopy images were obtained using Zeiss LSM 510 NLO with a 40 × water lens. C, Colocalization of mitochondria and ROS production in Arabidopsis. Cells were incubated with 0.5 μm MitoTracker Red 580 as a specific mitochondrial marker (red fluorescence, center column) and subsequently with H2DCF-DA (10 μm; green fluorescence, right column). After 20 min, cells were treated either with 10 mm AAN or buffer for 10 min. Confocal microscopy images were obtained using Zeiss LSM 510 NLO with a 40 × water lens. The experiment was repeated three times with similar results. D, Model proposed to explain the relation between GDC and AOX in modulating ROS production.
Figure 9.
Figure 9.
AAN-induced depolarization of mitochondrial membranes. AAN was used to study the effect of GDC inhibition in Arabidopsis. A, One-week-old cultured Arabidopsis cells were treated for 30 min with different inhibitors on the 96-well plate in the grow chamber. Afterward, JC-1 dye (5 μ g mL−1), to probe the mitochondrial membrane potential, and 10 mm AAN were added and the measurement was started. The mitochondrial depolarization was indicated by a decrease in the red-green fluorescence intensity ratio. The data represent the status of the mitochondrial membrane 30 min after AAN treatment. Black bars indicate the percentage of depolarization. SHAM, 2 mm; catalase, 100 units mL−1; cyclosporine A, 50 μm. Cyclosporine A was used as a control for complete polarization (100%). The experiment was repeated three times with similar results. Different letters indicate values statistically different based on a one-way ANOVA followed by Tukey's honestly significant difference posthoc test (F = 532.6, df = 7, P < 0.01). B, Model proposed to explain the relation between GDC and AOX in modulating depolarization mitochondrial membranes.
Figure 10.
Figure 10.
Visualization of AAN-induced cell death in Arabidopsis cell cultures. Confocal microscopy images were obtained using Zeiss LSM 510 NLO with a 40 × water lens. Cell death, measured as loss of plasma membrane integrity, was detected by double staining with Evans blue (red fluorescence, dead cells) and fluorescein diacetate (green fluorescence, living cells). After incubation with the dyes for 5 min, 10 mm AAN was added to the cell cultures and the fluorescence was visualized. The experiment was repeated three times with similar results.

Similar articles

Cited by

References

    1. Abe J, Takahashi M, Ishida M, Lee JD, Berk BC. (1997) c-Src is required for oxidative stress-mediated activation of big mitogen-activated protein kinase 1 (BMK1). J Biol Chem 272: 20389–20394 - PubMed
    1. Allan AC, Fluhr R. (1997) Two distinct sources of elicited reactive oxygen species in tobacco epidermal cells. Plant Cell 9: 1559–1572 - PMC - PubMed
    1. Asada K. (2006) Production and scavenging of reactive oxygen species in chloroplasts and their functions. Plant Physiol 141: 391–396 - PMC - PubMed
    1. Barchowsky A, Klei LR, Dudek EJ, Swartz HM, James PE. (1999) Stimulation of reactive oxygen, but not reactive nitrogen species, in vascular endothelial cells exposed to low levels of arsenite. Free Radic Biol Med 27: 1405–1412 - PubMed
    1. Barroso JB, Corpas FJ, Carreras A, Sandalio LM, Valderrama R, Palma JM, Lupianez JA, del Rio LA. (1999) Localization of nitric-oxide synthase in plant peroxisomes. J Biol Chem 274: 36729–36733 - PubMed

Publication types

MeSH terms

Substances