. 2010 Mar;152(3):1501-13.
doi: 10.1104/pp.109.150045. Epub 2010 Jan 20.

Glycolysis and the tricarboxylic acid cycle are linked by alanine aminotransferase during hypoxia induced by waterlogging of Lotus japonicus

Affiliations

Glycolysis and the tricarboxylic acid cycle are linked by alanine aminotransferase during hypoxia induced by waterlogging of Lotus japonicus

Marcio Rocha et al. Plant Physiol. 2010 Mar.

Abstract

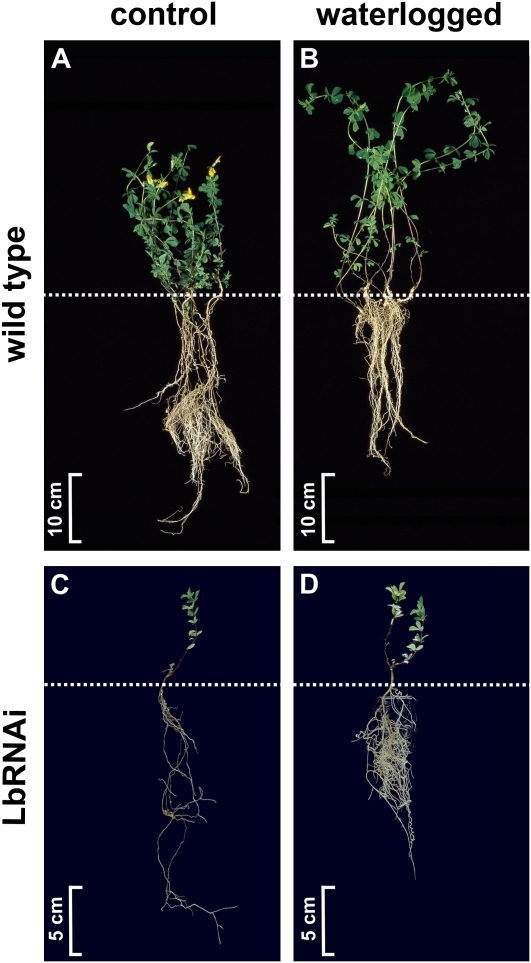
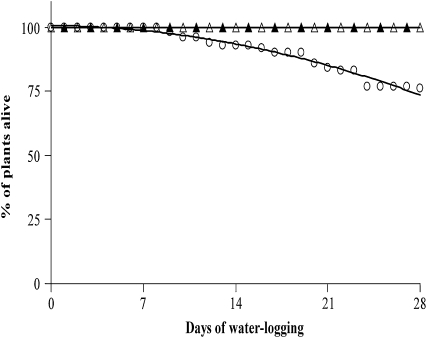
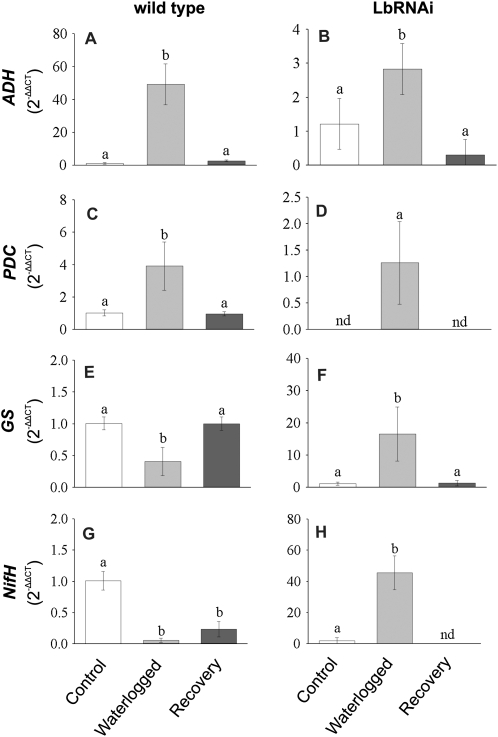
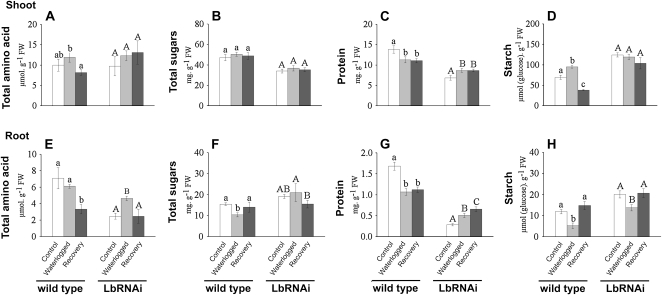
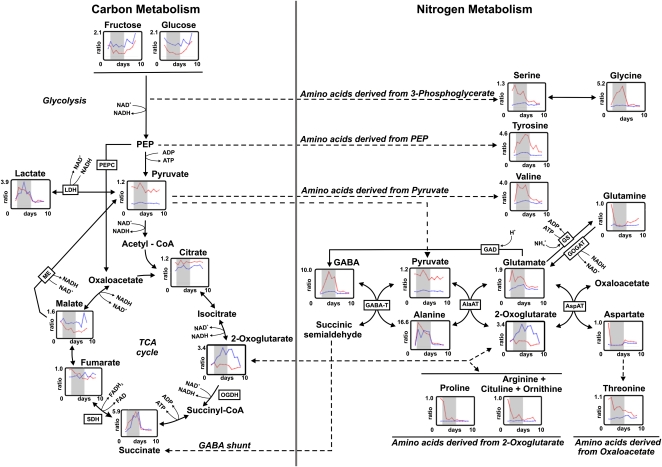
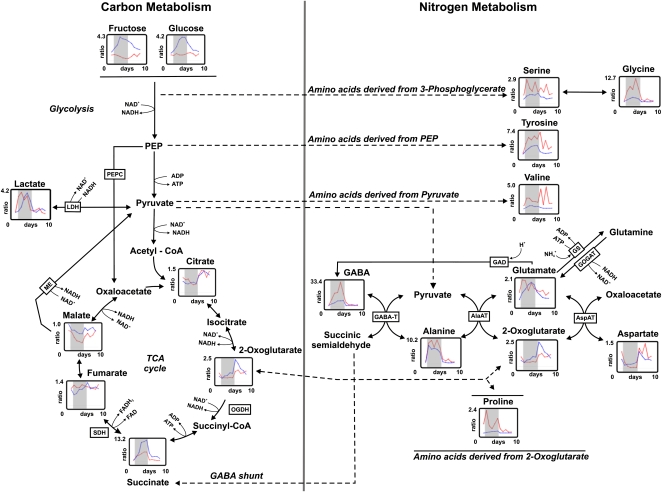
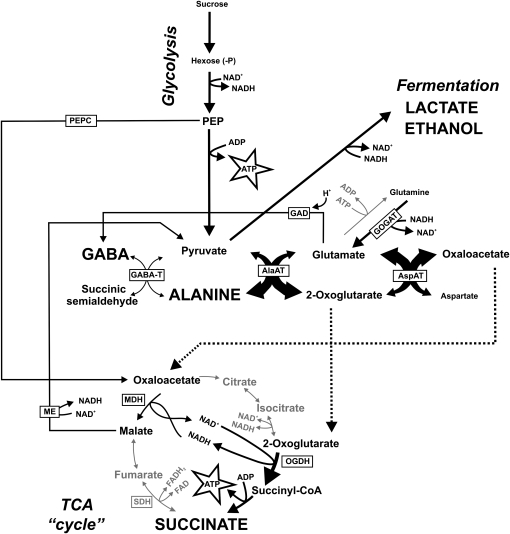
The role of nitrogen metabolism in the survival of prolonged periods of waterlogging was investigated in highly flood-tolerant, nodulated Lotus japonicus plants. Alanine production revealed to be a critical hypoxic pathway. Alanine is the only amino acid whose biosynthesis is not inhibited by nitrogen deficiency resulting from RNA interference silencing of nodular leghemoglobin. The metabolic changes that were induced following waterlogging can be best explained by the activation of alanine metabolism in combination with the modular operation of a split tricarboxylic acid pathway. The sum result of this metabolic scenario is the accumulation of alanine and succinate and the production of extra ATP under hypoxia. The importance of alanine metabolism is discussed with respect to its ability to regulate the level of pyruvate, and this and all other changes are discussed in the context of current models concerning the regulation of plant metabolism.


Figures

Figure 1.
Figure 1.
Phenotype of L. japonicus wild-type and LbRNAi plants before and during waterlogging. Ten-week-old wild-type (A and B) and LbRNAi (C and D) plants were photographed after a 4-week period of continuous waterlogging (B and D) or a similar growth period under control conditions (A and C). The photographs show representative plants of the entire population. The dotted lines indicate the transition from root to shoot.
Figure 2.
Figure 2.
Survival rate of L. japonicus wild-type and LbRNAi plants during an extended waterlogging period. The amount of healthy plants was determined throughout a period of 30 d for LbRNAi plants (circles) and for wild-type plants of the same age (black triangles) or the same size (white triangles) as the LbRNAi plants.
Figure 3.
Figure 3.
Changes in the transcript levels of hypoxia-responsive genes. Changes in the transcript levels of selected genes known to be induced by hypoxia. Samples from wild-type (A, C, E, and G) and LbRNAi (B, D, F, and H) plants were analyzed at normoxia, after 5 d of waterlogging, and after a 5-d recovery period. Values represent means ± sd of six replicates. Different letters denote significant differences among means judged by a one-way ANOVA in relation to the control (P < 0.05). nd, Not detected.
Figure 4.
Figure 4.
Determination of changes in total amino acids, protein, total soluble sugar, and starch in L. japonicus wild-type and LbRNAi plants. Quantification of total soluble amino acids (A and E), total soluble sugars (B and F), total protein (C and G), and starch (E and H) measured in shoot (A–D) and roots (E–H) of wild-type and LbRNAi plants. Samples were taken prior to any treatment (control), after 5 d of waterlogging, and after 5 d of recovery. Values are presented as means ± sd of six replicates. Bars marked with dissimilar letters are significantly different from each other by one-way ANOVA (P < 0.05).
Figure 5.
Figure 5.
Visualization of changes in selected metabolites of primary carbon and nitrogen metabolism in roots of L. japonicus wild-type and LbRNAi plants. Relative changes in the levels of metabolites as detected by GC-TOF-MS. Metabolite levels are calculated relative to the data obtained from wild-type tissue before waterlogging (day 0). The red line represents data obtained from wild-type plants, and the blue line shows values measured in LbRNAi plants. The gray area within each graph indicates the 5-d period during which the plants were waterlogged. Solid arrows indicate enzymatic reactions, and the dashed arrow link the same metabolite when this is present in two linked pathways. All data (±se) depicted in this figure are also listed in Supplemental Table S2. A full list of the levels of all metabolites that were detected can be found in Supplemental Table S1. GAD, Glu decarboxylase; GS, Gln synthetase; PEP, phosphoenolpyruvate; PEPC, phosphoenolpyruvate carboxylase.
Figure 6.
Figure 6.
Visualization of changes in selected metabolites of primary carbon and nitrogen metabolism in nodules of L. japonicus wild-type and LbRNAi plants. For an explanation of the experiment and the symbols and abbreviations used in the figure, see legend to Figure 5. The data (±se) that are shown in this figure are also listed in Supplemental Table S3.
Figure 7.
Figure 7.
Production of ethanol by nodulated roots from wild-type and LBRNAi plants during hypoxia. The level of ethanol was determined in the nutrient solution of the plants prior to the hypoxic treatment (control), after 5 d of hypoxia as induced by blowing nitrogen gas through the nutrient solution for 15 min, and 5 d after the plants were transferred to fresh, well-aerated nutrient solution to allow the tissue to recover from the hypoxic treatment. Values are presented as means ± sd. Bars that are marked with a dissimilar letters are judged to be significantly different from each other (one-way ANOVA, P < 0.05). nd, Not detected.
Figure 8.
Figure 8.
Changes in enzyme activities from roots as induced by waterlogging of wild-type L. japonicus plants. The maximum activity of PDH (A), aconitase (B), IDH (C), OGDH (D), MDH (E), ME (F), AlaAT (G), AspAT (H), and Glu synthase (I) were determined in root material that was collected from wild-type plants grown under normoxic control conditions or after 5 d of waterlogging. The bars indicate mean values ± sd of three independent biological replicate experiments. Means that differ significantly according to a one-way ANOVA (P < 0.05) are marked with different letters.
Figure 9.
Figure 9.
Metabolic model of primary metabolism under hypoxia in L. japonicus. When respiratory energy production is inhibited by decreased oxygen availability to a plant, drastic changes are observed in the steady-state levels of primary metabolites. Here, a model is described that agrees with the changes in metabolite levels and enzyme activities observed in L. japonicus during waterlogging. Pyruvate production is enhanced due to the activation of glycolysis (Pasteur effect). To keep glycolysis going, cytosolic NAD+ must be continuously regenerated from NADH via fermentation reactions that lead to the accumulation of lactate and ethanol. By producing pyruvate, ATP is formed. Accumulation of pyruvate should be prevented during hypoxia as this activates respiratory oxygen consumption (Zabalza et al., 2009). Via AlaAT, the amount of pyruvate can be reduced. Moreover, this reaction produces 2-oxoglutarate, which can be used by OGDH and succinate CoA ligase to produce another ATP. Succinate will accumulate as the TCA cycle will be further blocked due to the oxygen limitation at the reaction catalyzed by SDH. The mitochondrial NAD+ that is required to oxidize 2-oxoglutarate can be recycled via the enzyme MDH, which obtains its substrate either via phosphoenolpyruvate carboxylase (PEPC) or via AspAT. The latter enzyme is known to be activated upon anoxia and provides Glu as a substrate for AlaAT. All reactions leading to the production of pyruvate can be catalyzed by enzymes that are located within the mitochondrion. The model explains why Ala and succinate accumulate during anoxia in plants and provides a pathway that improves the ATP production during anoxia.

Similar articles

Cited by

References

    1. Araújo WL, Nunes-Nesi A, Trenkamp S, Bunik VI, Fernie AR. (2008) Inhibition of 2-oxoglutarate dehydrogenase in potato tuber suggests the enzyme is limiting for respiration and confirms its importance in nitrogen assimilation. Plant Physiol 148: 1782–1796 - PMC - PubMed
    1. Armstrong W, Brändle R, Jackson MB. (1994) Mechanisms of flood tolerance in plants. Acta Bot Neerl 43: 307–358
    1. Bailey-Serres J, Voesenek LACJ. (2008) Flooding stress: acclimations and genetic diversity. Annu Rev Plant Biol 59: 313–339 - PubMed
    1. Besson-Bard A, Pugin A, Wendehenne D. (2008) New insights into nitric oxide signaling in plants. Annu Rev Plant Biol 59: 21–39 - PubMed
    1. Bologa KL, Fernie AR, Leisse A, Loureiro ME, Geigenberger P. (2003) A bypass of sucrose synthase leads to low internal oxygen and impaired metabolic performance in growing potato tubers. Plant Physiol 132: 2058–2072 - PMC - PubMed

Publication types

LinkOut - more resources