. 2010 Mar;152(3):1471-83.
doi: 10.1104/pp.109.149815. Epub 2010 Jan 20.

The heat-inducible transcription factor HsfA2 enhances anoxia tolerance in Arabidopsis

Affiliations

The heat-inducible transcription factor HsfA2 enhances anoxia tolerance in Arabidopsis

Valeria Banti et al. Plant Physiol. 2010 Mar.

Abstract

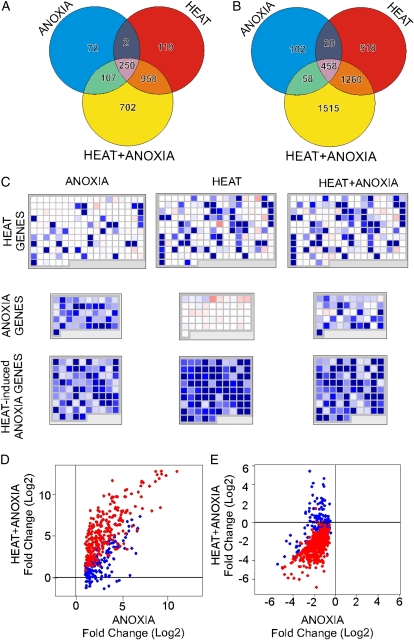
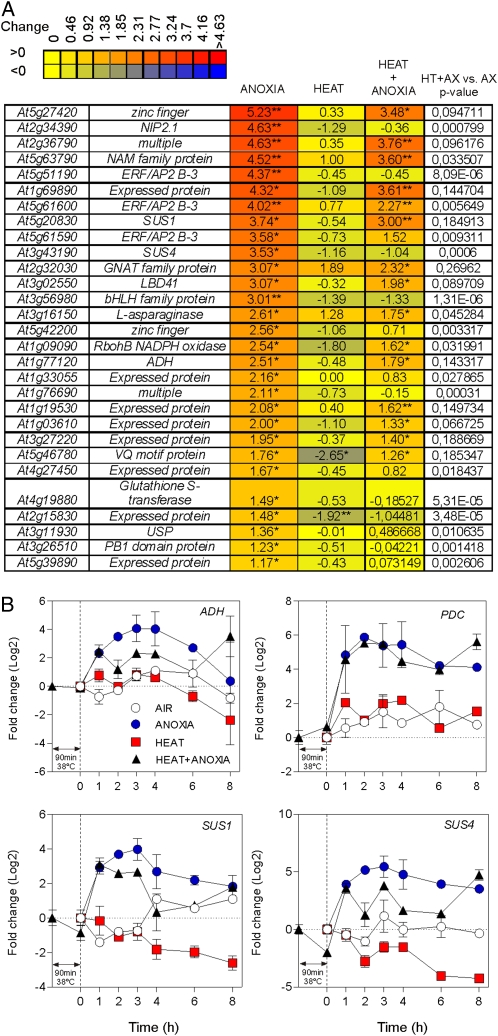
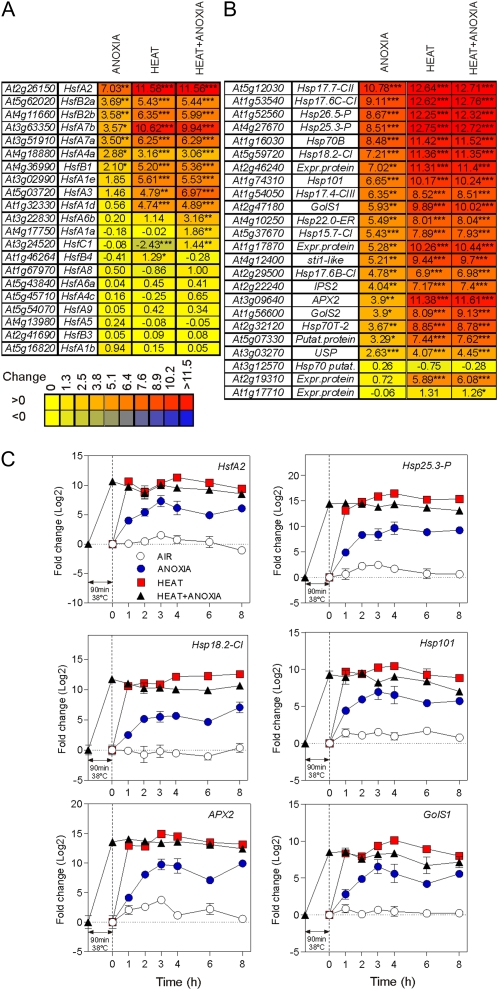
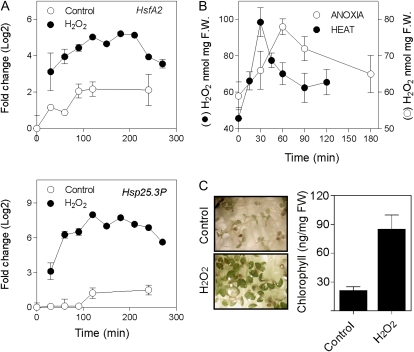
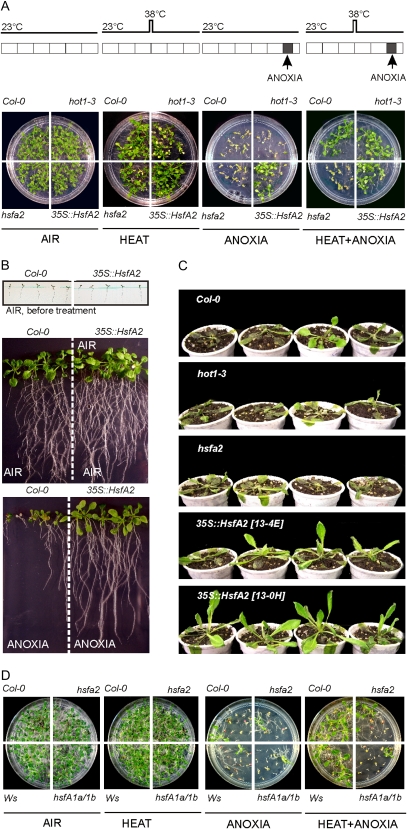
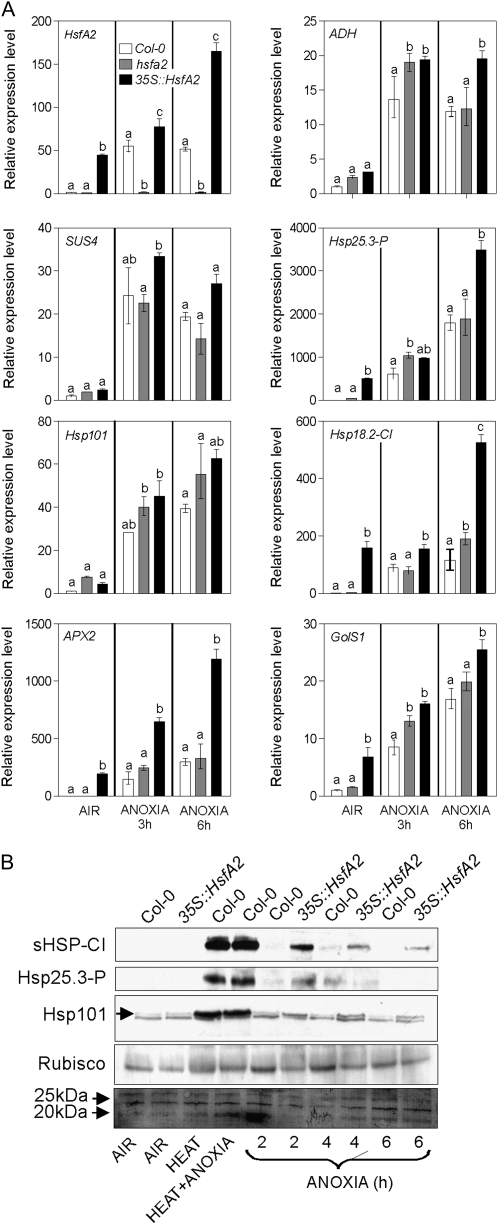
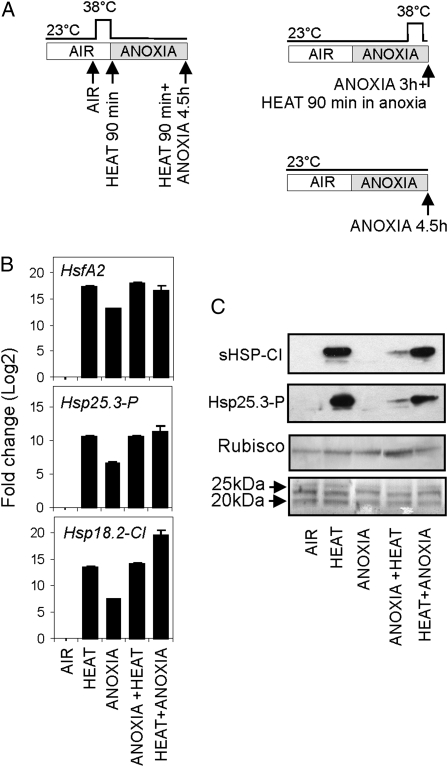
Anoxia induces several heat shock proteins, and a mild heat pretreatment can acclimatize Arabidopsis (Arabidopsis thaliana) seedlings to subsequent anoxic treatment. In this study, we analyzed the response of Arabidopsis seedlings to anoxia, heat, and combined heat + anoxia stress. A significant overlap between the anoxic and the heat responses was observed by whole-genome microarray analysis. Among the transcription factors induced by both heat and anoxia, the heat shock factor A2 (HsfA2), known to be involved in Arabidopsis acclimation to heat and to other abiotic stresses, was strongly induced by anoxia. Heat-dependent acclimation to anoxia is lost in an HsfA2 knockout mutant (hsfa2) as well as in a double mutant for the constitutively expressed HsfA1a/HsfA1b (hsfA1a/1b), indicating that these three heat shock factors cooperate to confer anoxia tolerance. Arabidopsis seedlings that overexpress HsfA2 showed an increased expression of several known targets of this transcription factor and were markedly more tolerant to anoxia as well as to submergence. Anoxia failed to induce HsfA2 target proteins in wild-type seedlings, while overexpression of HsfA2 resulted in the production of HsfA2 targets under anoxia, correlating well with the low anoxia tolerance experiments. These results indicate that there is a considerable overlap between the molecular mechanisms of heat and anoxia tolerance and that HsfA2 is a player in these mechanisms.


Figures

Figure 1.
Figure 1.
Transcriptome analysis of anoxia-, heat-, and heat + anoxia-treated Arabidopsis seedlings. A and B, Venn diagrams showing genes with differential expression (A, up-regulated; B, down-regulated). Genes were selected on the basis of their fold changes (≥ 2-fold or ≤−2-fold) and their FDR (≤ 0.05). C, MapMan representation of the effects of anoxia, heat, and heat + anoxia on genes annotated as “heat responsive” or “anoxia responsive.” D and E, Effects of the heat pretreatment on the expression levels of anoxic genes. Genes induced (D) or repressed (E) by anoxia were plotted on the basis of their fold change following the anoxic treatment (horizontal axis) and the heat + anoxia treatment (vertical axis). Red dots represent genes induced or repressed by either anoxia or heat, while blue dots represent genes that were not found to be heat responsive. Relative expression levels are shown as fold change values (log2).
Figure 2.
Figure 2.
Effects of anoxia, heat, and combined heat + anoxia treatments on the expression of selected anaerobic genes. A, Heat map showing the expression of anaerobic genes showing a reduced expression in the combined heat + anoxia treatment. Expression data were visualized using Heatmapper Plus software (http://bbc.botany.utoronto.ca/ntools/cgibin/ntools_heatmapper_plus.cgi). The fold change is shown as log2. Statistical significance for the comparison “treatment versus control (air, 23°C)” is reported: ** FDR ≤ 0.01, * FDR ≤ 0.05. The FDR P value for the comparison “combined heat + anoxia treatment versus anoxia” is shown in the table (HT + AX versus AX P value). B, Time courses of gene expression following anoxia, heat, and combined heat + anoxia treatments. The fold change (log2) was measured by qPCR using time = 0 (air) as a reference.
Figure 3.
Figure 3.
Effects of anoxia, heat, and combined heat + anoxia treatments on the expression of Hsf-related genes. A, Heat map showing the effects of anoxia, heat, and combined heat + anoxia treatments on the expression of Hsf genes. Expression data were visualized using Heatmapper Plus software (http://bbc.botany.utoronto.ca/ntools/cgibin/ntools_heatmapper_plus.cgi). The output of the software is shown. The fold change is shown as log2. Statistical significance is reported: *** FDR ≤ 0.001, ** FDR ≤ 0.01, * FDR ≤ 0.05. B, Heat map showing the effects of anoxia, heat, and combined heat + anoxia treatments on the expression of putative targets of HsfA2. Details are as in A. C, Time courses of gene expression following anoxia, heat, and combined heat + anoxia treatments. The fold change (log2) was measured by real-time qPCR using time = 0 (air) as a reference.
Figure 4.
Figure 4.
Effects of H2O2 on the expression of HsfA2 and Hsp25.3P. A, Expression of HsfA2 and Hsp25.3P following treatment with 5 mm H2O2 for the times indicated. Seedlings were grown in liquid medium for 4 d in the dark. H2O2 (5 mm) was added for the time shown. The fold change (log2) was measured by qPCR using time = 0 as a reference. B, H2O2 production under anoxia and heat (38°C). C, Effects of 5 mm H2O2 on anoxia tolerance. Seedlings were grown in liquid medium for 4 d in the dark. H2O2 (5 mm) was added (2-h treatment) to the wells containing the seedlings followed by rinsing in fresh medium and transfer to anoxia (26 h). The photographs show the seedlings recovering (5 d) after the anoxic treatment. The chlorophyll content in replicated (n = 3) samples is shown in the histogram. FW, Fresh weight.
Figure 5.
Figure 5.
Role of HsfA2 in anoxia tolerance. A, Tolerance assay in Col-0, hot1-3, hsfA2, and 35S::HsfA2. A schematic representation of treatments is shown. Each box represents 1 d. The gray box represents the anoxic treatment (13 h). Photographs were taken 1 week after the end of the treatments. The results shown refer to 35S::HsfA2 line 13-OH. Comparable results were obtained using the independent 35S::HsfA2 line 13-4E. B, Tolerance assay in Col-0 and 35S::HsfA2 seedlings grown on vertical plates. The anoxic treatment was 13 h long. Photographs were taken before treatment and 2 weeks after the end of the anoxic treatment. The results shown refer to 35S::HsfA2 line 13-OH. Comparable results were obtained using the independent 35S::HsfA2 line 13-4E. C, Tolerance assay in Col-0, hot1-3, hsfA2, and 35S::HsfA2 plants grown in pots and subjected to 24 h of complete submergence in the dark. The results shown refer to both 35S::HsfA2 lines 13-OH and 13-4E. D, Tolerance assay in hsfA2, its wild type (Col-0), the double mutant hsfA1a/1b, and its wild type (Wassilewskija [Ws]). A schematic representation of the treatments is shown in A. Photographs were taken 1 week after the end of the treatments.
Figure 6.
Figure 6.
Effects of HsfA2 on the expression of anaerobic and heat-related genes and proteins. A, Expression of HsfA2, ADH, SUS4, HSP25.3-P, HSP101, HSP18.2-CI, APX2, and GolS1 in Col-0, hsfA2, and 35S::HsfA2 seedlings. Relative expression levels are shown as fold change values (1 = Col-0, air). Differences among genotypes within each treatment (air, 3 h of anoxia, and 6 h of anoxia) were evaluated by two-way ANOVA (Bonferroni posttest P < 0.05). Bars represent means of at least three measurements ± sd. B, Immunoblotting of proteins extracted from 4-d-old dark-grown seedlings treated under anoxia. The antibodies used recognized HSP25.3-P, sHSP-CI, and HSP101 (the specific bands are indicated by the arrows). Blots were stained with Ponceau-S and probed with an antibody recognizing the large subunit of Rubisco to confirm even loading and transfer. Treatments were as follows: air, heat (90 min at 38°C), heat + anoxia (90 min at 38°C followed by 6 h under anoxia), and anoxia (2–6 h).
Figure 7.
Figure 7.
Effects of anoxia on HSP mRNA and protein accumulation. A, Schematic representation of treatments. B, Expression of HSFA2, HSP25.3-P, and HSP18.2-CI in Col-0 seedlings. Relative expression levels are shown as fold change values (log2; using “air” as a reference). C, Immunoblotting of proteins extracted from 4-d-old dark-grown seedlings treated under anoxia. The antibodies used recognized HSP25.3-P and sHSP-CI. Blots were stained with Ponceau-S and reprobed with an antibody recognizing the large subunit of Rubisco to confirm even loading and transfer.

Similar articles

Cited by

References

    1. Bailey-Serres J, Chang R. (2005) Sensing and signaling in response to oxygen deprivation in plants and other organisms. Ann Bot (Lond) 96: 507–518 - PMC - PubMed
    1. Bailey-Serres J, Voesenek LA. (2008) Flooding stress: acclimations and genetic diversity. Annu Rev Plant Biol 59: 313–339 - PubMed
    1. Banti V, Loreti E, Novi G, Santaniello A, Alpi A, Perata P. (2008) Heat acclimation and cross-tolerance against anoxia in Arabidopsis. Plant Cell Environ 31: 1029–1037 - PubMed
    1. Bieniawska Z, Barratt DHP, Garlick AP, Thole V, Kruger NJ, Martin C, Zrenner R, Smith AM. (2007) Analysis of the sucrose synthase gene family in Arabidopsis. Plant J 49: 810–828 - PubMed
    1. Blokhina O, Virolainen E, Fagerstedt K. (2002) Antioxidants, oxidative damage and oxygen deprivation stress: a review. Ann Bot (Lond) 91: 173–194 - PMC - PubMed

MeSH terms