. 2010 Mar 15;21(6):1125-39.
doi: 10.1091/mbc.e09-04-0292. Epub 2010 Jan 20.

Vav3-deficient mice exhibit a transient delay in cerebellar development

Affiliations

Vav3-deficient mice exhibit a transient delay in cerebellar development

Celia Quevedo et al. Mol Biol Cell. .

Abstract

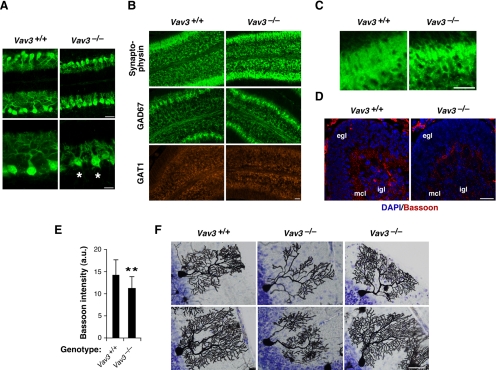
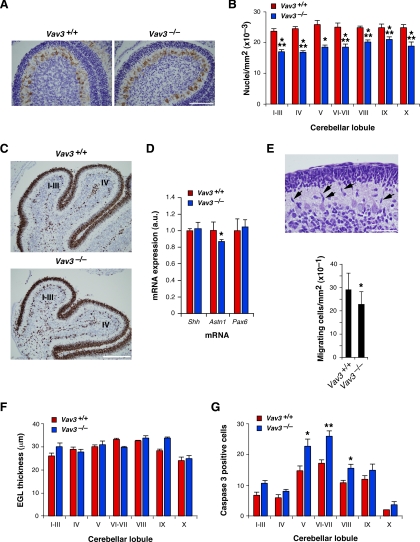
Vav3 is a guanosine diphosphate/guanosine triphosphate exchange factor for Rho/Rac GTPases that has been involved in functions related to the hematopoietic system, bone formation, cardiovascular regulation, angiogenesis, and axon guidance. We report here that Vav3 is expressed at high levels in Purkinje and granule cells, suggesting additional roles for this protein in the cerebellum. Consistent with this hypothesis, we demonstrate using Vav3-deficient mice that this protein contributes to Purkinje cell dendritogenesis, the survival of granule cells of the internal granular layer, the timely migration of granule cells of the external granular layer, and to the formation of the cerebellar intercrural fissure. With the exception of the latter defect, the dysfunctions found in Vav3(-/-) mice only occur at well-defined postnatal developmental stages and disappear, or become ameliorated, in older animals. Vav2-deficient mice do not show any of those defects. Using primary neuronal cultures, we show that Vav3 is important for dendrite branching, but not for primary dendritogenesis, in Purkinje and granule cells. Vav3 function in the cerebellum is functionally relevant, because Vav3(-/-) mice show marked motor coordination and gaiting deficiencies in the postnatal period. These results indicate that Vav3 function contributes to the timely developmental progression of the cerebellum.


Figures

Figure 1.
Figure 1.
Vav3 is expressed in Purkinje and granular cells of the mouse cerebellum. (A) Anti-Vav3 immunohistochemical analysis of sagittal cerebellar sections obtained from wild-type (left) and Vav3−/− (right) mice. mcl, molecular cell layer; gcl, granular cell layer. Bar, 50 μm. Detection of Vav3 immunoreactivity is observed in sections from wild-type animals in both Purkinje cells and in scattered areas of the granular cell layer. (B) Total RNA samples obtained from wild type and Vav3−/− granular cell cultures were subjected to RT-PCR analysis using oligonucleotide primers specific for the mouse Vav3 cDNA (top). As control, aliquots of the same RNAs were amplified using oligonucleotide primers specific for the mouse P36b4 cDNA (bottom). Final PCR products were separated electrophoretically in agarose gels and photographed. (C) Total RNAs obtained from the cerebella of wild-type mice at the indicated postnatal (P) stages were subjected to RT-PCR analysis using oligonucleotide primers for the mouse Vav3 (top) and P36b4 (bottom) cDNAs and processed as indicated above. These results of this figure show that Vav3 is expressed at different levels in the cerebellum in a developmental-dependent manner (C). Furthermore, Vav3 is expressed in this tissue at least in Purkinje (A) and granule cells (B).
Figure 2.
Figure 2.
Histological and cytological alterations in cerebella obtained from Vav3-deficient mice. (A) Sagittal cerebellar sections from P15 (top) and adult stages (bottom) obtained from wild-type (left) and Vav3-deficient (right) were stained with hematoxylin and eosin and analyzed by light microscopy. Bar, 1 mm. It is observed a normal structure of the cerebella of Vav3-deficient mice, with the exception of a poorly developed intercrural fissure that separates cerebellar lobules VI and VII (compare areas of the left and right panels that have been pointed out by arrows). (B) Detection by immunofluorescence of the expression of GFAP in sagittal cerebellar sections obtained from P6 wild-type (left) and Vav3−/− (right) mice. Pictures show representative images obtained in cerebellar lobule IV. Similar results were obtained in the rest of cerebellar lobules analyzed (data not shown). Bar, 60 μm. No changes in the distribution of GFAP are seen in the cerebella of control and Vav3-deficient mice.
Figure 3.
Figure 3.
Deficient dendritic arborization of Vav3−/− Purkinje cells. (A) Sagittal cerebellar slices from P6 wild-type (left) and Vav3−/− (right) mice were stained with an anti-calbindin antibody to visualize Purkinje cells. Representative fluorescence images for the lateral part of lobule V and VI are shown in low- (top; bar, 60 μm) and high (bottom; bar, 30 μm)-power views. Signals derived from calbindin are seen in green color in the images. Asterisks label two Purkinje cells with two dendrite main trunks branching out independently from the soma. A clear defect in the arborization of the dendritic tree of Purkinje cells is observed in Vav3-deficient mice. Note also that the thickness of the molecular layer is reduced in those animals (compare top panels). (B and C) Detection by immunofluorescence techniques of the expression of synaptophysin (B, top; for a magnification of those images, see C), GAD67 (B; second row of panels from top), and GAT1 (B; third row of panels from top) in sagittal cerebellar sections obtained from P6 wild-type mice (B and C; left) and Vav3−/− mice (B and C; right). Signals from synaptophysin (B and C) and GAD67 (B) are shown in green. Those from GAT1 are shown in red (B). Pictures show representative images obtained in cerebellar lobule IV. Similar results were obtained in the rest of cerebellar lobules analyzed (data not shown). Bar, 60 μm. (D) Detection by immunofluorescence techniques of the expression of the presynaptic Bassoon marker in cerebellar sections obtained from P6 wild-type mice (left) and Vav3-deficient mice (right). Signals from Bassoon protein are shown in red. Those from the 4,6-diamidino-2-phenylindole counterstaining are shown in blue. Bar, 100 μm. The cerebellar regions corresponding to the external granular cell layer (egl), the molecular cell layer (mcl), and the internal granular cell layer (igl) are indicated. (E) Quantification of Bassoon immunoreactivity in the molecular layer of the cerebella obtained from mice of the indicated genotypes (n = 4 animals). **p < 0.01 compared with wild-type controls. a.u., arbitrary units. It is observed that Vav3-deficient mice show lower levels of Bassoon immunoreactivity in their cerebellar molecular layers. (F) Examples of Golgi-stained Purkinje cells present in sections of adult mice cerebella obtained from wild-type mice (left) and Vav3-deficient mice (middle and right). Bar, 50 μm. With the exception of a Purkinje cell shown in the middle bottom panel, the structure of wild-type and Vav3-deficient Purkinje cells is similar (compare rest of panels).
Figure 4.
Figure 4.
Pleiotropic effects of the Vav3 proto-oncogene deficiency in cerebellar granular cells. (A) Sagittal sections of P6 cerebella from wild-type mice (left) and Vav3−/− mice (right) were immunolabeled with an anti-calbindin antibody to identify Purkinje cells and then stained with hematoxylin. Bar, 100 μm. A reduction in cell density is observed in the IGL from Vav3-deficient mice. (B) Quantification of the cell density (measured as number of nuclei per square millimeter) present in the IGL of the indicated cerebellar lobules of wild-type animals (red bars) and Vav3 knockout animals (blue bars). The histogram shows the mean and the SEM obtained in each cerebellar lobule using experimental data from four different animals and two independent litters per genotype. *p < 0.05, **p < 0.01, and ***p < 0.001 compared with wild-type controls. A statistically significant reduction in the number of cells present in the IGL is observed in Vav3−/− mice. (C) Immunohistochemical analysis of Ki67 protein expression in sagittal cerebellar sections from P6 mice from wild-type mice (top) and Vav3−/− mice (bottom). Pictures show representative images for lobules I–III and IV. Bar, 200 μm. No significant variations in proliferating cells were observed between control and Vav3 knockout animals. (D) Quantitation by RT-PCR of proliferative (Shh) and migratory (Astn1, Pax6) granule cells in the cerebella of P6 wild-type mice (red bars; n = 3) and Vav3-deficient mice (blue bars; n = 5). *p < 0.05 compared with wild-type controls. The graph shows that some migration markers (Astn1) are down-modulated in Vav3-deficient mice. Instead, no alterations are found in the expression of the proliferative and migratory Shh and Pax6 markers, respectively. (E) Top, example of “tear drop”-shaped granule cells in the molecular layer of a wild type cerebellum. Some migrating cells are shown by arrows. Bar, 50 μm. Bottom, quantitation (measured as number of cells per square millimeter) of the number of migrating granular cells in the molecular layers of wild-type and Vav3−/− mice. *p < 0.05 compared with wild-type controls. The graph shows that there is a slight, although statistically significant reduction in the number of migrating cells in the cerebella from Vav3-deficient mice. (F) Sagittal sections of P6 wild-type mice (red bars) and Vav3−/− mice (blue bars) were stained with hematoxylin and eosin, and the thickness of the EGL was measured in all lobules as described in Materials and Methods. Values represent the mean and SEM from two different animals and two different litters for each genotype. No statistically significant variations were observed in the EGL thickness between wild-type and Vav3-deficient mice at the P6 stage. (G) Sagittal cerebellar sections from P6 wild-type mice (red bars) and Vav3−/− mice (blue bars) were immunolabeled with an anti-cleaved caspase-3 antibody and the number of apoptotic cells in the IGL quantified de visu. Values represent the mean and SEM of the total number of apoptotic cells relative to de total number of cells present in the IGL. A minimum of four different animals and three different litters for each genotype were analyzed. *p < 0.05 and **p < 0.01 compared with wild-type controls. A statistically significant increase in the percentage of apoptotic cells was observed in the lobules V, VI–VII, and VIII of 6d-old Vav3-deficient mice.
Figure 5.
Figure 5.
P10 Vav3−/− mice show a defect in cerebellar layer formation but not in IGL apoptosis. (A) Quantification of the cell density (measured as number of nuclei per square millimeter) present in the IGL of the indicated cerebellar lobules of P10 wild-type mice (red bars) and Vav3-deficient mice (blue bars). The histogram shows the mean and the SEM obtained in each cerebellar lobule using experimental data from four different animals and two independent litters per genotype. No differences are observed in the cell densities of P10 IGLs from wild-type and Vav3-deficient mice. (B) Sagittal sections obtained from the vermis of P10 wild-type (red bars) and Vav3-deficient (blue bars) animals were stained with hematoxylin and eosin, and the thickness of the EGL measured in all lobules as described in Materials and Methods. Values represent the mean and SEM from five different animals coming from two different litters for each genotype. *p < 0.05, **p < 0.01, and p < 0.001 compared with wild-type controls. A statistically significant increase in the thickness of the EGLs of cerebellar lobules I–III, IV, V, VI–VII, and IX is observed in Vav3-deficient animals. (C) Sagittal sections from the vermis of P10 wild-type (top) and Vav3−/− (bottom) mice were stained and subjected to immunofluorescence experiments using antibodies to calbindin (left and right) and phospho-panTrk (middle and right). The immunoreactivity obtained with the anti-calbindin and phospho-panTrk antibodies is shown in green and red, respectively. Areas of colocalization are observed in yellow (right). Representative images show part of lobule V and VI. Similar staining patterns were observed throughout all cerebellar cortices analyzed. Bar, 60 μm. Anti-panTrk immunoreactivity was localized around the upper region of the molecular layer that lies beneath the EGL. This is the region were the tips of the extending dendrites of Purkinje cells and the PF terminals extending from granule cells are concentrated. Such staining is reduced in the same areas of Vav3-deficient animals. (D and E) Cellular extracts from wild-type and Vav3−/− granule cells stimulated with BDNF for the indicated periods of time were analyzed by Western blot (WB) analysis using antibodies to phospho-TrkB (D, top), α-tubulin (D, bottom), phospho-Akt (E, top), phospho-Erk (E, middle), and Erk (E, bottom) (n = 5). p, phosphorylated. No significant changes in the phosphorylation levels of TrkB (D), Akt (E), and Erk (E) were observed in BDNF-stimulated Vav3-deficient granule cells compared with their wild-type counterparts. (F) Production of BDNF by cerebella obtained from P10 animals (n = 5). **p < 0.01 compared with wild-type controls. A statistically significant decrease in BDNF production was observed in the cerebella from Vav3-deficient animals.
Figure 6.
Figure 6.
Vav3 regulates dendritic outgrowth in Purkinje and granular cells. (A) Examples of the morphology of Purkinje cells obtained in mixed cultures derived from wild-type mice (left) and Vav3-deficient mice (right). To obtain these images, cell cultures were fixed, stained with anti-calbindin antibodies, and subjected to microscopy analysis. Less dendritic arborization is apparent in cultures generated from Vav3−/− mice. (B) Quantification of the Purkinje cell morphology in cultures derived from cerebella of the indicated genotypes. Quantification included the total dendritic tree area (left), the length of the longest dendrite (middle), and the number of branching points (right) in Purkinje cells (n = 4 independent experiments). **p < 0.01 compared with wild-type controls. A reduced number of tips is observed in Vav3-deficient Purkinje cells (right). No statistically significant differences were observed in the other two parameters evaluated in these experiments. (C) Expression levels of MAP2 in cultures of granule cell cultures of the indicated genotypes (top). At the indicated divisions in vitro (DIV, top), cellular lysates were obtained, electrophoretically fractionated in 6% SDS-PAGE gels, transferred onto nitrocellulose, and MAP2 levels were determined by anti-MAP2 Western blot (WB) analysis (top). Equal loading was demonstrated by the detection of a nonspecific band recognized by the anti-MAP2 antibody (middle) and by reblotting with an anti-vinculin antibody (bottom). (D) Quantification of MAP2 protein expression in granular cell cultures. Bands from the anti-MAP2 immunoblots obtained in three independent experiments were quantified by densitometry analysis and statistically analyzed. Data are presented as mean and SEM and were normalized taking into consideration the protein levels of vinculin detected in each sample. *p < 0.05 compared with wild-type controls. Reduced numbers of MAP2 are seen in cultures from Vav3-deficient mice. (E) Example of wild-type granule cells expressing EGFP alone (left l) or in combination with wild-type Vav3 (right). Cells were processed and transfected as indicated in Materials and Methods, fixed at division 4, and photographed using an inverted fluorescence microscope. Bar, 30 μm. Increased dendrite ramifications are seen in the granular cell expressing the Vav3 protein. (F) Quantitation of the total dendritic length (left) and the number of tips (right) of granular cells that were transfected with plasmids encoding the indicated proteins (n = 50 independent cells in each transfection). ***p < 0.001 compared with wild-type controls. Vav3 overexpression promotes an increase in the total length and number of tips in the transfected cells.
Figure 7.
Figure 7.
Cerebellar structure of Vav2-deficient mice. (A) Total RNAs obtained from the cerebella of wild-type mice and Vav3−/− mice at the indicated P stages were subjected to RT-PCR analysis using oligonucleotide primers for the mouse Vav2 (top) and P36b4 (bottom) cDNAs. Final PCR products were separated electrophoretically in agarose gels and photographed. The figure shows the expression of Vav2 mRNA in all cerebellar stages analyzed and that such expression is not affected by the Vav3 gene deficiency. (B) Sagittal cerebellar sections from P6 wild-type animals (left) and P6 Vav2-deficient animals (right) were stained with hematoxylin–eosin and analyzed by light microscopy. Bar, 500 μm. No major alterations in cerebellar structure or lobulation are seen in Vav2-deficient mice. (C) Sagittal cerebellar slices from P6 wild-type mice (left) and Vav2−/− mice (right) mice subjected to immunostaining with anti-calbindin antibodies and visualized by immunofluorescence microscopy. Bar, 500 μm. No major alterations in Purkinje cell number or dendritogenesis are observed in Vav2-deficient mice. (D) Quantification of the cell density (measured as number of nuclei per square millimeter) present in the IGL of the indicated cerebellar lobules of P6 wild-type mice (red bars) and Vav2-deficient mice (blue bars). The histogram shows the mean and the SEM obtained in each cerebellar lobule using experimental data from three different animals and two independent litters per genotype. *p < 0.05 compared with wild-type controls.
Figure 8.
Figure 8.
Age-dependent motor coordination problems in Vav3-deficient mice. (A and B) Performance obtained by 5-wk-old (A) and 4-mo-old (red squares) wild-type mice and Vav3-deficient mice (blue squares) during standardized accelerating Rotarod tests (n = 7–9). *p < 0.05 and **p < 0.01 compared with wild-type controls. (C and D) Representative gait analysis of 5-wk-old (C) and 4-mo-old (D) wild-type mice and Vav3-deficient mice ascending an inclined plane. Front and hind paws were painted in red and blue, respectively. (E and F) Quantification of the results obtained in the gait analysis. The distance done by front (F) and hind (H) paws (E) and the distance between the left (L) and right paws (R) of the same side (F) were measured for animals of the indicated genotypes (n = 7–10). Values obtained with 5-wk- and 4-mo-old mice are shown (left and right, respectively). Values derived using wild-type and knockout mice are shown in red and blue bars in the histograms, respectively. The major coordination defects are observed in 5-wk-old Vav3-deficient mice. *p < 0.05 and **p < 0.01 compared with wild-type controls.

Similar articles

Cited by

References

    1. Adams N. C., Tomoda T., Cooper M., Dietz G., Hatten M. E. Mice that lack astrotactin have slowed neuronal migration. Development. 2002;129:965–972. - PubMed
    1. Aghazadeh B., Lowry W. E., Huang X. Y., Rosen M. K. Structural basis for relief of autoinhibition of the Dbl homology domain of proto-oncogene Vav by tyrosine phosphorylation. Cell. 2000;102:625–633. - PubMed
    1. Altman J. Postnatal development of the cerebellar cortex in the rat. I. The external germinal layer and the transitional molecular layer. J. Comp. Neurol. 1972a;145:353–397. - PubMed
    1. Altman J. Postnatal development of the cerebellar cortex in the rat. II. Phases in the maturation of Purkinje cells and of the molecular layer. J. Comp. Neurol. 1972b;145:399–463. - PubMed
    1. Altman J. Postnatal development of the cerebellar cortex in the rat. III. Maturation of the components of the granular layer. J. Comp. Neurol. 1972c;145:465–513. - PubMed

Publication types