. 2010 Mar 15;21(6):871-84.
doi: 10.1091/mbc.e09-12-1017. Epub 2010 Jan 20.

Biological and structural basis for Aha1 regulation of Hsp90 ATPase activity in maintaining proteostasis in the human disease cystic fibrosis

Affiliations

Biological and structural basis for Aha1 regulation of Hsp90 ATPase activity in maintaining proteostasis in the human disease cystic fibrosis

Atanas V Koulov et al. Mol Biol Cell. .

Abstract

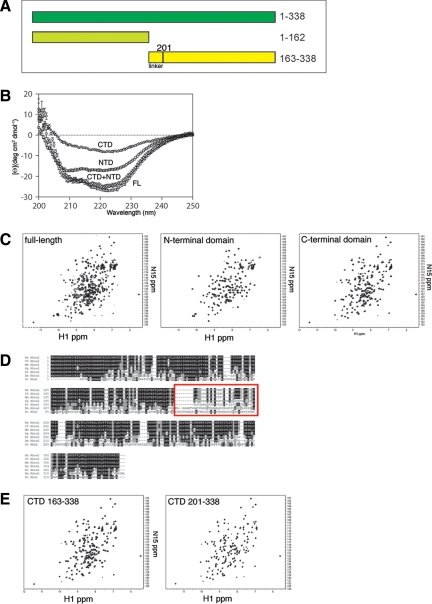
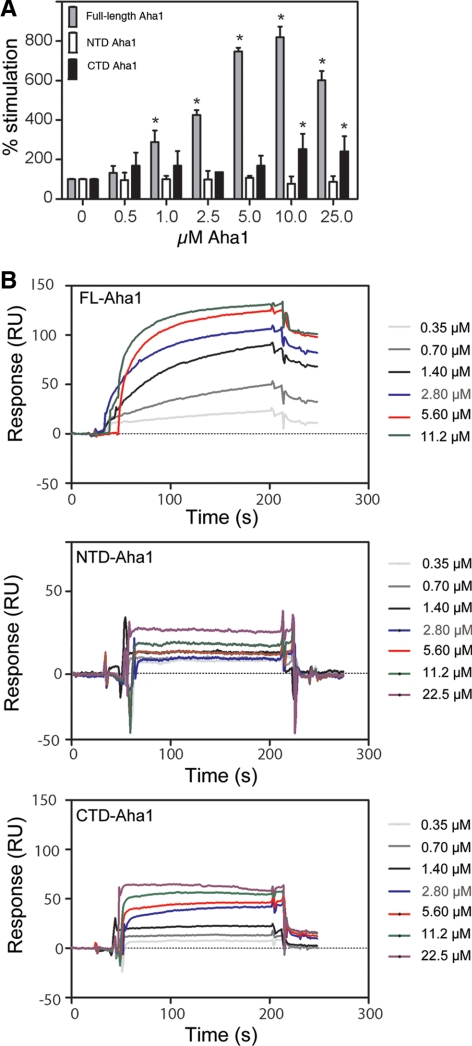
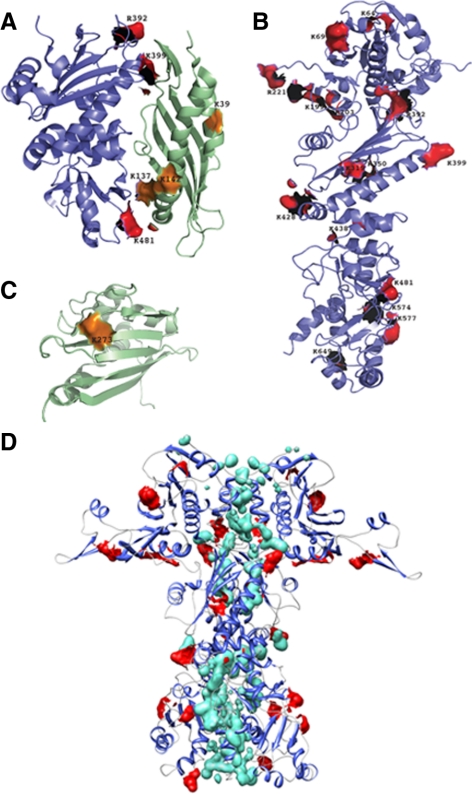
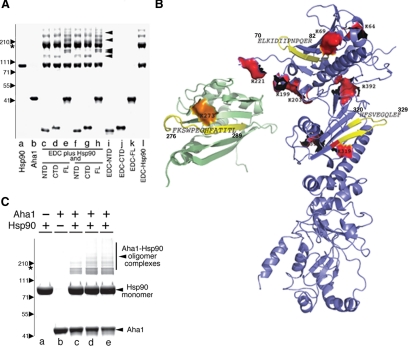
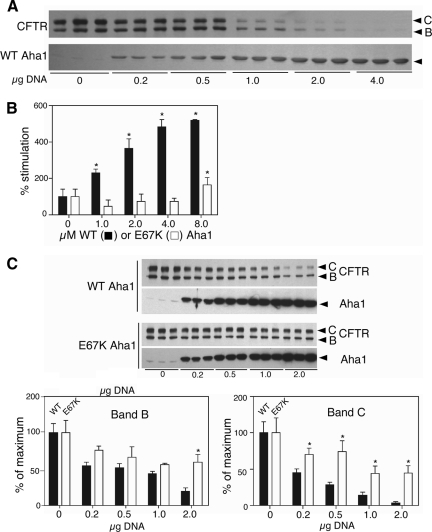
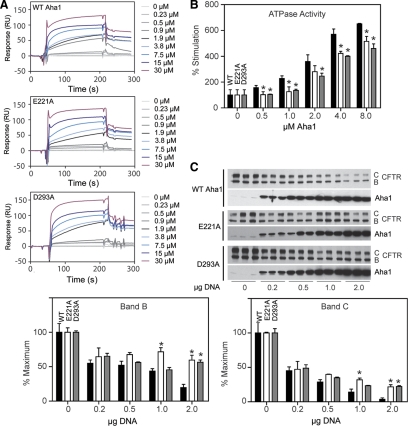
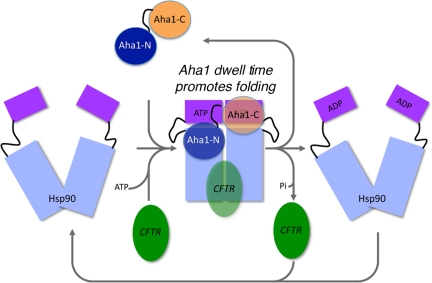
The activator of Hsp90 ATPase 1, Aha1, has been shown to participate in the Hsp90 chaperone cycle by stimulating the low intrinsic ATPase activity of Hsp90. To elucidate the structural basis for ATPase stimulation of human Hsp90 by human Aha1, we have developed novel mass spectrometry approaches that demonstrate that the N- and C-terminal domains of Aha1 cooperatively bind across the dimer interface of Hsp90 to modulate the ATP hydrolysis cycle and client activity in vivo. Mutations in both the N- and C-terminal domains of Aha1 impair its ability to bind Hsp90 and stimulate its ATPase activity in vitro and impair in vivo the ability of the Hsp90 system to modulate the folding and trafficking of wild-type and variant (DeltaF508) cystic fibrosis transmembrane conductance regulator (CFTR) responsible for the inherited disease cystic fibrosis (CF). We now propose a general model for the role of Aha1 in the Hsp90 ATPase cycle in proteostasis whereby Aha1 regulates the dwell time of Hsp90 with client. We suggest that Aha1 activity integrates chaperone function with client folding energetics by modulating ATPase sensitive N-terminal dimer structural transitions, thereby protecting transient folding intermediates in vivo that could contribute to protein misfolding systems disorders such as CF when destabilized.


Figures

Figure 1.
Figure 1.
Domain structure of Aha1. (A) Schematic of Aha1 domains. Full-length (FL) human Aha1 (amino acids 1-338 shown in dark green), Aha1 N-terminal domain (NTD; amino acids 1-162 shown in light green), and Aha1 C-terminal domain (CTD; amino acids 163-338 shown in yellow). The position of the linker region (residues 163-200) is illustrated. (B) CD spectra of FL (circles), NTD (square), CTD (triangles), and NTD and CTD spectra added (diamonds). (C) NMR spectra of FL (left), NTD (middle), and CTD (right) domains of Aha1. (D) Sequence alignment of Aha1 from different organisms from yeast (bottom row) to human (top row). Prefixes denote the first letters of genus and species name. Red box indicates the position where the putative linker region that lacks evolutionary conservation. See Supplemental Figure S1 for an enlarged view of alignment. (E) NMR spectrum of shortened C-terminal Aha1 domain lacking the linker region (amino acids 201-338; right) next to the NMR spectrum of original C-terminal domain (left).
Figure 2.
Figure 2.
Effect of increasing Aha1 on Hsp90 binding and ATPase. (A) Hsp90 ATPase assay with increasing amount of full-length (FL), N-terminal domain (NTD), and C-terminal domain (CTD) of Aha1. We incubated 4 μM final Hsp90 with the indicated amounts of Aha1 or domains (final micromolar) for 90 min as described in Materials and Methods. Generation of Pi was detected and measured using a malachite green assay (see Materials and Methods). ATPase activity is expressed as a percentage of Hsp90 alone. Asterisks denote statistically significant increases over Hsp90 alone (two-tailed t test, p < 0.05). Consistent with previous reports (McLaughlin et al., 2004; Onuoha et al., 2008), the intrinsic ATPase activity of Hsp90 was 0.02 min−1 ± 0.005. (B) SPR analysis of Hsp90 interaction with full-length Aha1 (FL-Aha1), and the N-terminal domain (NTD) and C-terminal domain (CTD) of Aha1 (residues 1-162 and 163-338, respectively). Hsp90 was coupled to a CM5 chip as described in Materials and Methods. Raw data are reported as arbitrary RUs (y-axis) as measured at the indicated time (x-axis) in seconds. Binding constants were determined as described in Materials and Methods and Results. See Supplemental Table S1 for Kon and Koff values.
Figure 3.
Figure 3.
Molecular footprinting of the interaction between Hsp90 and Aha1. (A) Footprinting was performed as described in Materials and Methods. Protected residues on Hsp90 (shown in red) and Aha1 (shown in orange) are depicted on the crystal structure of the middle domain of Hsp90 (blue) and the N-terminal domain of Aha1 (green) (Protein Data Base [PDB]: 1USV). (B) Hsp90 residues protected from modification in the Aha1–Hsp90 complex are depicted in red on the three-dimensional structure of the Hsp90 (homology model based on the yeast crystal structure [PDB: 2CG9]). (C) Aha1 residues protected from modification in the Aha1–Hsp90 complex are depicted in orange on the three-dimensional structure of the C-terminal domain of the human Aha1 (PDB: 1X53). (D) Homology of the Hsp90 dimer based on the yeast crystal structure (PDB: 2CG9) illustrating the position of protected residues (red) relative to residues forming the dimer interface (green).
Figure 4.
Figure 4.
Analysis of binding of Aha1 cross-linked to Hsp90. (A) A 4–12% gradient SDS-PAGE of purified Hsp90 (lane a) and Aha1 (lane b). Full-length (lanes e, h, and k), N-terminal domain (lanes c, f, and i), or C-terminal domain (lanes d, g, and j) were incubated in the presence of Hsp90 (c–h) or alone in the presence of zero-length (EDC) cross-linker (lanes i–l) in the presence of 1× (c–e) or 2× (f–h) cross-linker as described in Materials and Methods. No cross-linking was observed in any incubation that only contained full-length, or N- and C-terminal domains of Aha1. Incubation of Hsp90 with EDC revealed higher order oligomers reflecting its known C-terminal and N-terminal interaction motifs. Black arrowheads show the Aha1–Hsp90 complexes captured by the EDC cross-linker. The position of the Hsp90 is indicated by the asterisk. Migration of indicated molecular weight markers are shown to the left of the panel. (B) Hsp90 peptides cross-linked to Aha1 are colored in yellow (also see Table 2). Aha1 peptide cross-linked to Hsp90 is shown in yellow on the structure of the C-terminal domain of the protein (PBD: 1X53). Protected residues identified by footprinting in the Hsp90 N-terminal and middle domain (see Figure 3) are shown in red; Aha1 C-terminal residues protected from modification in Aha1–Hsp90 complexes (see Figure 3) are shown in orange. (C) Full-length Aha1 was modified with ANB-NOS, incubated with unlabeled Hsp90, and complexes were photocross-linked for 1 min (lane c), 2 min (lane d), and 3 min (lane e) and separated using a 4–12% gradient gel as described in Materials and Methods. Higher order oligomers are not observed upon incubation of unmodified Hsp90 (lane a) alone or cross-linker modified Aha1 (lane b) alone. The potential migration position of an Hsp90 dimer based on molecular weight markers (left) is shown by the asterisk (see A). Higher molecular weight bands >220 kDa represent complexes of Aha1 with two or more monomers of Hsp90.
Figure 5.
Figure 5.
Effect of Aha1 mutants on CFTR folding and trafficking. (A) Dose-dependent destabilization of CFTR overexpression with the indicated amount of Aha1 plasmid. Western blotting performed with indicated antibody to CFTR (top) or Aha1 (bottom). The three identical samples illustrate the response of cells to overexpression in three separate experiments. (B) Hsp90 ATPase assay using wild-type (black bars) and E67K (white bars) of Aha1 with the indicated amount (μg) of Aha1 as described in Materials and Methods. Asterisks denote statistically significant increase in ATPase activity over Hsp90 alone (two-tailed t test, p < 0.05). (C) Coexpression of increasing amounts of Aha1 (WT or E67K) with WT-CFTR shows that E67K is impaired in its ability to destabilize CFTR. Western blotting performed with indicated antibody to CFTR or Aha1 (top). Quantification of CFTR destabilization by WT (black bars) and E67K (white bars) Aha1 overexpression (bottom). Asterisks denote statistically significant difference between band B or C levels in cells expressing E67K or WT-Aha1 (two-tailed t test, p < 0.05). The three identical samples illustrate the response of cells to overexpression in three separate experiments.
Figure 6.
Figure 6.
Analysis of E221A and D293A mutants in vitro. (A) SPR analysis of the indicated amount of E221A and D293A mutants of Aha1 with Hsp90 as described in Materials and Methods. (B) Hsp90 ATPase assay with the indicated amount (micromolar) of WT (black bars), E221A (white bars), and D293A (gray bars) Aha1. Asterisks denote statistically significant differences between WT and mutants at the same concentration (analysis of variance [ANOVA], p < 0.05). (C) Coexpression of increasing amounts of WT, E221A, and D293A Aha1 with WT-CFTR. Western blotting performed with indicated antibody to CFTR or Aha1 (top). Quantification of CFTR destabilization in response to WT (black bars), E221A (white bars), and D293A (gray bars) Aha1 overexpression (bottom). Asterisks denote statistically significant differences between band B or C levels in cells expressing E221A and WT Aha1, or D293A and WT Aha1 (ANOVA, p < 0.05).
Figure 7.
Figure 7.
Aha1 functions as molecular referee to promote Hsp90 ATPase activity regulating client folding and WT/ΔF508 CFTR trafficking. Aha1 binds in trans to the dynamically cycling Hsp90 dimer. Binding of the N-terminal domain of Aha1 occurs to the middle domain of Hsp90. The C-terminal domain of Aha1 binds to the N terminus of Hsp90 to promote ATP hydrolysis by stabilization of the N-terminal dimer interface. We propose that the differential dwell time (Mickler et al., 2009) of the client-Hsp90 complex in response to the Aha1 ATPase activating activity is a critical event in dictating success or failure of folding of WT and ΔF508 CFTR, and other clients by the Hsp90 chaperone–cochaperone system. The dwell time for required for proper client folding is probably a key determinant of the activity of the proteostasis program.

Similar articles

Cited by

References

    1. Aridor M., Bannykh S. I., Rowe T., Balch W. E. Cargo can modulate COPII vesicle formation from the endoplasmic reticulum. J. Biol. Chem. 1999;274:4389–4399. - PubMed
    1. Aridor M., Weissman J., Bannykh S., Nuoffer C., Balch W. E. Cargo selection by the COPII budding machinery during export from the ER. J. Cell Biol. 1998;141:61–70. - PMC - PubMed
    1. Balch W. E., Morimoto R. I., Dillin A., Kelly J. W. Adapting proteostasis for disease intervention. Science. 2008;319:916–919. - PubMed
    1. Cunningham C. N., Krukenberg K. A., Agard D. A. Intra- and intermonomer interactions are required to synergistically facilitate ATP hydrolysis in Hsp90. J. Biol. Chem. 2008;283:21170–21178. - PMC - PubMed
    1. Fuller W., Cuthbert A. W. Post-translational disruption of the delta F508 cystic fibrosis transmembrane conductance regulator (CFTR)-molecular chaperone complex with geldanamycin stabilizes delta F508 CFTR in the rabbit reticulocyte lysate. J. Biol. Chem. 2000;275:37462–37468. - PubMed

Publication types

MeSH terms

Substances

LinkOut - more resources