. 2010 Mar 15;21(6):1001-10.
doi: 10.1091/mbc.e09-08-0693. Epub 2010 Jan 20.

Combinational soluble N-ethylmaleimide-sensitive factor attachment protein receptor proteins VAMP8 and Vti1b mediate fusion of antimicrobial and canonical autophagosomes with lysosomes

Affiliations

Combinational soluble N-ethylmaleimide-sensitive factor attachment protein receptor proteins VAMP8 and Vti1b mediate fusion of antimicrobial and canonical autophagosomes with lysosomes

Nobumichi Furuta et al. Mol Biol Cell. .

Abstract

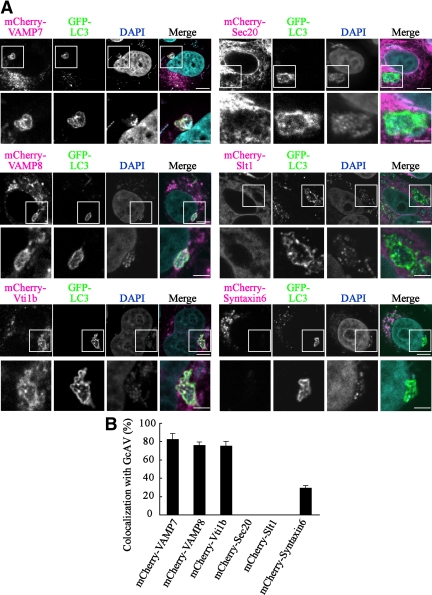
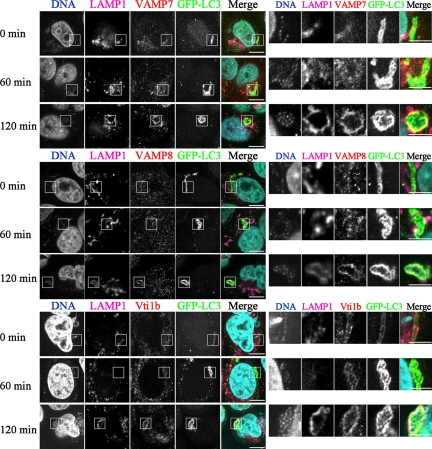
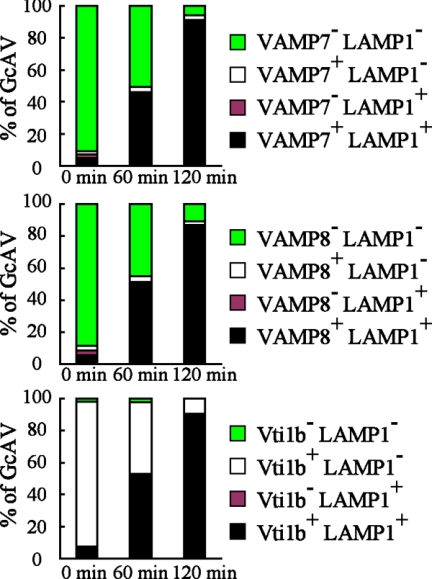
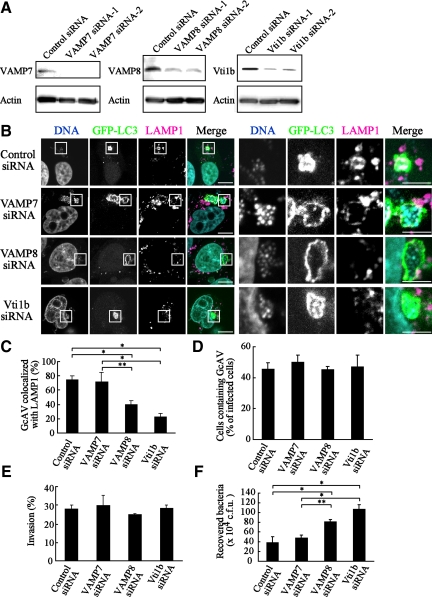
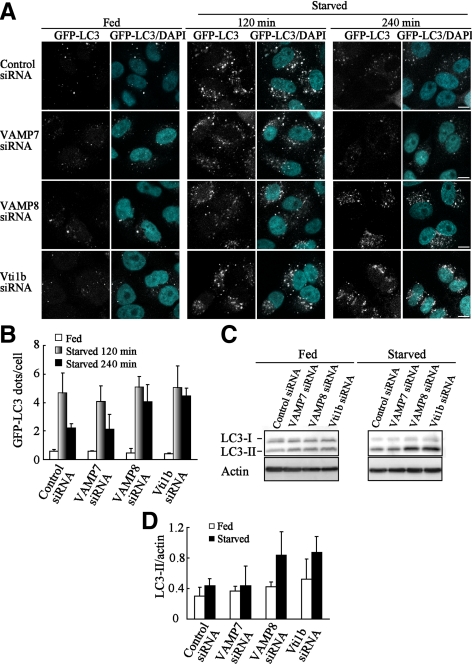
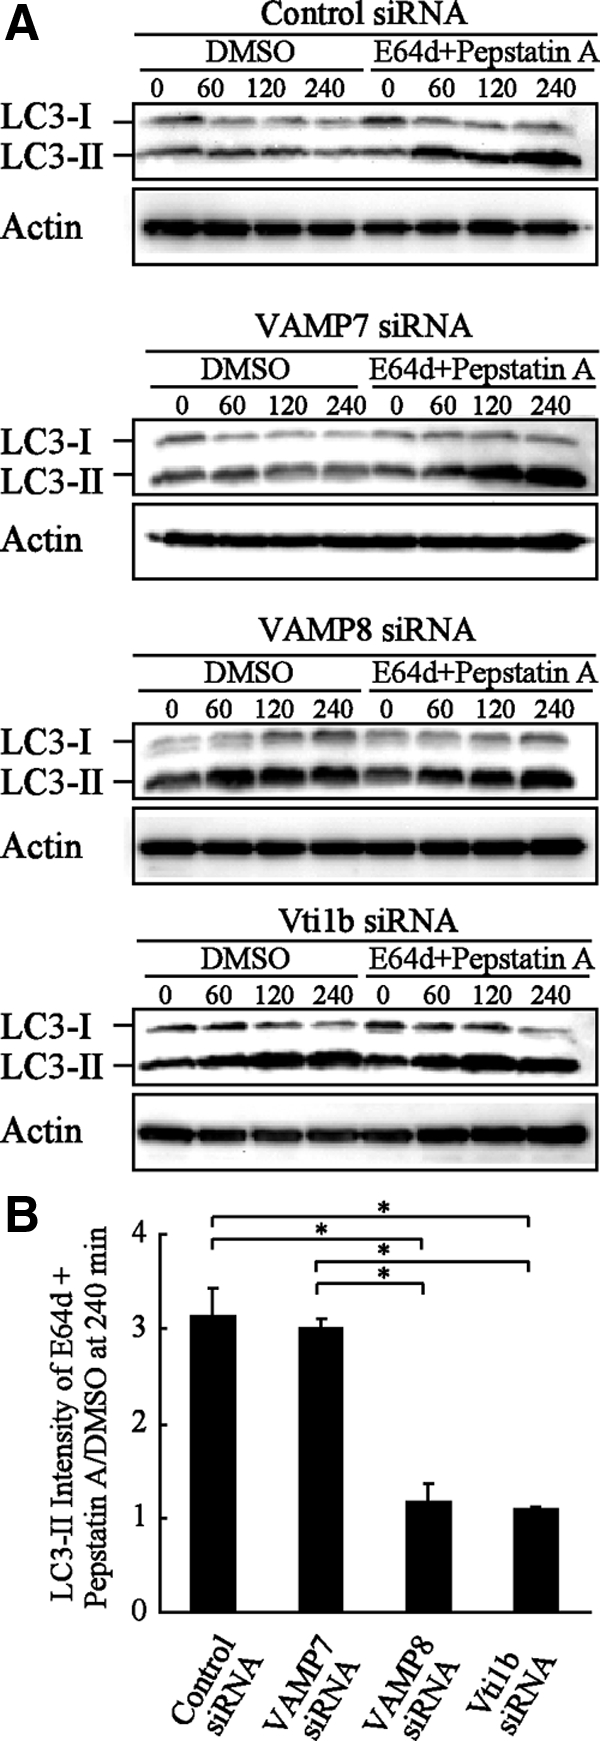
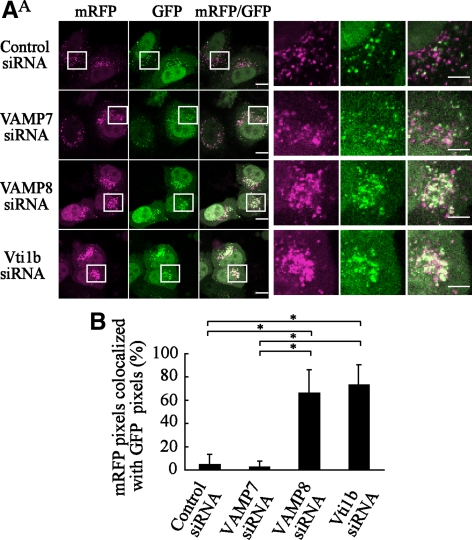
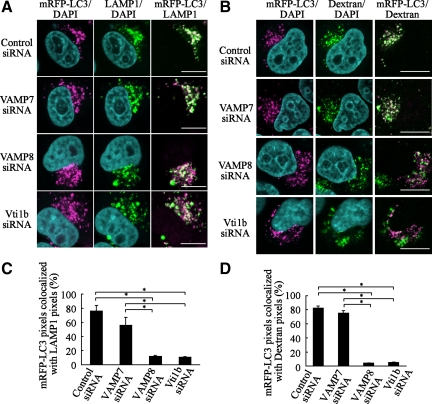
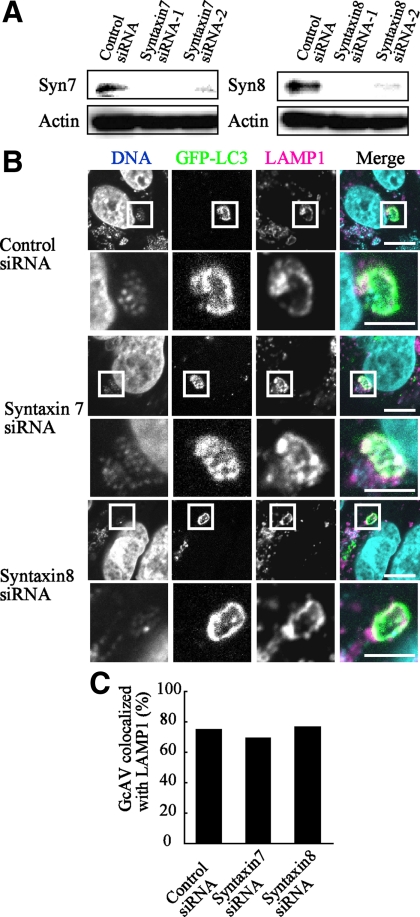
Autophagy plays a crucial role in host defense, termed antimicrobial autophagy (xenophagy), as it functions to degrade intracellular foreign microbial invaders such as group A Streptococcus (GAS). Xenophagosomes undergo a stepwise maturation process consisting of a fusion event with lysosomes, after which the cargoes are degraded. However, the molecular mechanism underlying xenophagosome/lysosome fusion remains unclear. We examined the involvement of endocytic soluble N-ethylmaleimide-sensitive factor attachment protein receptors (SNAREs) in xenophagosome/lysosome fusion. Confocal microscopic analysis showed that SNAREs, including vesicle-associated membrane protein (VAMP)7, VAMP8, and vesicle transport through interaction with t-SNAREs homologue 1B (Vti1b), colocalized with green fluorescent protein-LC3 in xenophagosomes. Knockdown of Vti1b and VAMP8 with small interfering RNAs disturbed the colocalization of LC3 with lysosomal membrane protein (LAMP)1. The invasive efficiency of GAS into cells was not altered by knockdown of VAMP8 or Vti1b, whereas cellular bactericidal efficiency was significantly diminished, indicating that antimicrobial autophagy was functionally impaired. Knockdown of Vti1b and VAMP8 also disturbed colocalization of LC3 with LAMP1 in canonical autophagy, in which LC3-II proteins were negligibly degraded. In contrast, knockdown of Syntaxin 7 and Syntaxin 8 showed little effect on the autophagic fusion event. These findings strongly suggest that the combinational SNARE proteins VAMP8 and Vti1b mediate the fusion of antimicrobial and canonical autophagosomes with lysosomes, an essential event for autophagic degradation.


Figures

Figure 1.
Figure 1.
Colocalization of GFP-LC3 with SNAREs in GcAVs. (A) HeLa cells stably expressing GFP-LC3 were transfected with plasmids to express mCherry-Sec20, Slt1, Syntaxin 6, Vti1b, VAMP7, and VAMP8. At 24 h after transfection, the cells were infected with GAS for 180 min at an MOI of 100, as described in Materials and Methods. Cellular and bacterial DNAs were stained with DAPI. The boxed regions in the top panels are enlarged in the bottom panels. Bars, 10 μm (top) and 5 μm (bottom). (B) Colocalization frequencies of GcAVs with several mCherry signals were manually determined as the percentage of the total number of GcAVs. Data shown represent results of >60 cells and each ratio (percentage) represents the mean value ± SD from three independent experiments.
Figure 2.
Figure 2.
Colocalization of GFP-LC3 with VAMP7, VAMP8, and Vti1b in GcAVs. HeLa cells stably expressing GFP-LC3 were infected with GAS for 60 min at an MOI of 100. Infected cells were washed and incubated with antibiotics for the indicated time periods and then fixed and incubated with anti-LAMP1, VAMP7, VAMP8, and Vti1b antibodies. Cellular and bacterial DNAs were stained with DAPI. The boxed regions in the left panels are enlarged in the right panels. Bars, 10 μm (left) and 5 μm (right).
Figure 3.
Figure 3.
Colocalization of GcAVs with SNAREs and LAMP1. The colocalization frequencies of GcAVs with VAMP7, VAMP8, and Vti1b in Figure 2 were determined. SNARE- and LAMP1-negative cells are shown in green, SNARE-positive and LAMP1-negative cells in white, SNARE-negative and LAMP1-positive cells in red, and SNARE- and LAMP1-positive cells in blue. The numbers of those signals were manually counted and are presented as a percentage of the total number of GcAVs. Data shown represent results of >60 cells.
Figure 4.
Figure 4.
Knockdown of VAMP8 and Vti1b disturbed the antimicrobial effects of GcAVs. (A) HeLa cells were transfected with siRNA for the control, VAMP7, VAMP8, and Vti1b. At 48 h after transfection, the cells were lysed and then examined by Western blotting using anti-Vti1b, -VAMP7, -VAMP8, and actin antibodies. (B) HeLa cells expressing GFP-LC3 were treated with siRNA in the same manner as described in A. After 48 h, cells were infected with GAS for 60 min at an MOI of 100. After an additional 120 min of incubation with antibiotics for bacterial killing, the cells were fixed and incubated with anti-LAMP1 antibodies and observed with a confocal microscope. Cellular and bacterial DNAs were stained with DAPI. The boxed regions in the left panels are shown enlarged in the right panels. Bars, 10 μm (left) and 5 μm (right). (C) Colocalization frequencies of GcAVs with LAMP1 signals were manually determined and are presented as the percentage of total number of GcAVs. Data shown represent results of >60 cells, and each ratio (percentage) represents the mean value ± SD from three independent experiments. *p < 0.01; **p < 0.05 by one-way ANOVA and Scheffé's posttest. (D) Numbers of cells containing GcAVs were counted and are presented as the percentage of the total number of GAS infected cells. HeLa cells stably expressing GFP-LC3 were transfected with siRNA and infected with GAS in the same manner as described in B. Data shown represent results of >30 cells and each ratio (percentage) represents the mean value ± SD from three independent experiments. (E) Efficiency of GAS invasion was measured as described in Materials and Methods. Data are shown as the mean ± SD from three independent experiments. (F) Viability of invaded GAS in HeLa cells was evaluated as described in Materials and Methods. Data are shown as the mean ± SD from three independent experiments. *p < 0.01; **p < 0.05 by one-way ANOVA and Scheffé's posttest.
Figure 5.
Figure 5.
Knockdown of VAMP8 and Vti1b disturbed the maturation of canonical autophagosomes. (A) HeLa cells stably expressing GFP-LC3 were treated with siRNA in the same manner as described in Figure 4A. The cells were further cultured in growth medium (Fed) or EBS solution (Starved) for the indicated periods and then fixed and observed with a confocal microscope. Cellular DNA was stained with DAPI (blue). Bars, 10 μm. (B) Quantitative analysis of the number of GFP-LC3 puncta per cell shown in A was performed using ImageJ software. More than 100 cells were examined. Data are shown as the mean ± SD (C) siRNA-treated HeLa cells were cultured in Fed and Starved conditions for 240 min. The cellular lysates were subjected to western blotting using anti-LC3 and actin antibodies. (D) Quantitative analysis of Western blot bands shown in C was performed using ImageJ software. Data show the ratios of LC3-II band intensities to the actin bands. Values are shown as the mean ± SD from three independent experiments.
Figure 6.
Figure 6.
LC3-II proteins accumulated without degradation in VAMP8- and Vti1b-depleted HeLa cells. (A) HeLa cells were treated with siRNA in the same manner as described in Figure 4A. At 48 h after transfection, the cells were cultured in starved solution (EBS) with or without proteinase inhibitors for the indicated times. The cellular lysates were examined to measure the amounts of LC3-II proteins with Western blotting using anti-LC3 and actin antibodies. DMSO was used as the control. (B) Quantitative analysis of the relative intensities of the LC3-II bands (inhibitor treated/control) after 240 min in A was performed using ImageJ software. The mean values ± SD are shown from three independent experiments. *p < 0.01 by one-way ANOVA and Scheffé's posttest.
Figure 7.
Figure 7.
Impaired degradation of LC3 proteins in autophagosomes from VAMP8- and Vti1b-depleted cells. (A) HeLa cells were transfected with siRNA for the control, VAMP7, VAMP8, and Vti1b. At 24 h after transfection, the cells were further transfected with plasmids expressing tf-LC3. After 24 h of incubation, the cells were subjected to a starved condition for 180 min and then fixed and observed with a confocal microscope. The boxed regions in the left panels are enlarged in the right panels. Bars, 10 μm (left) and 5 μm (right). (B) The colocalization frequencies of mRFP with GFP signals shown as tf-LC3 pixels in A were determined using LSM Image Browser software (Carl Zeiss) and are presented as the percentage of total number of mRFP pixels. Values are shown as the mean ± SD of >60 cell images. *p < 0.01 by one-way ANOVA and Scheffé's posttest.
Figure 8.
Figure 8.
Colocalization of mRFP-LC3 with LAMP1 in VAMP8- and Vti1b-depleted cells. (A) HeLa cells were transfected with siRNA for the control, VAMP7, VAMP8, and Vti1b. At 24 h after transfection, the cells were further transfected with plasmids expressing mRFP-LC3. After 24 h of incubation, the cells were subjected to a starved condition for 180 min, followed by fixation and incubation with anti-LAMP1 antibodies and then observed with a confocal microscope. Cellular DNA was stained with DAPI. Bars, 10 μm. (B) HeLa cells were preloaded with Alexa 488 dextran for marking lysosomes, as described in Materials and Methods. Cellular DNA was stained with DAPI. Bars, 10 μm. (C) The colocalization frequencies of mRFP shown as LAMP1 pixels were determined using LSM Image Browser software (Carl Zeiss) and are presented as the percentage of total number of mRFP pixels. Values are shown as the mean ± SD of >30 images. *p < 0.01 by one-way ANOVA and Scheffé's posttest. (D) The colocalization frequency of mRFP-LC3 shown as Alexa 488 dextran pixels was determined using LSM Image Browser (Carl Zeiss) and presented as the percentage of total number of mRFP pixels. The mean value ± SD of >30 cell images is shown. *p < 0.01 by one-way ANOVA and Scheffé's posttest.
Figure 9.
Figure 9.
Antimicrobial effects of GcAVs on Syntaxin 7 and Syntaxin 8-depleted cells. (A) HeLa cells were transfected with siRNA for the control, Syntaxin 7, and Syntaxin 8. At 48 h after transfection, the cells were lysed and examined by Western blotting using anti-Syntaxin 7, -Syntaxin 8, and actin antibodies. (B) HeLa cells stably expressing GFP-LC3 were transfected with siRNA for the control, Syntaxin 7, and Syntaxin 8. After 48 h, the cells were infected with GAS for 180 min at an MOI of 100 as described in Materials and Methods. After fixation, the cells were incubated with anti-LAMP1 antibodies and observed with a confocal microscope. Cellular and bacterial DNA were stained with DAPI. The boxed regions in the top panels are enlarged in the bottom panels. Bars, 10 μm (top) and 5 μm (bottom). (C) Colocalization frequencies of GcAVs with LAMP1 signals were manually determined and are presented as the percentage of total number of GcAVs. Data shown represent results of >30 cells.
Figure 10.
Figure 10.
Maturation of canonical autophagosomes in Syntaxin 7 and Syntaxin 8-depleted cells. (A) MCF7 cells were transfected with siRNA for the control, Syntaxin 7, and Syntaxin 8. At 48 h after transfection, the cells were lysed and then examined by Western blotting using anti-Syntaxin 7, -Syntaxin 8, and actin antibodies. (B) MCF7 cells stably expressing GFP-LC3 were treated with siRNA in the same manner as described in A. The cells were further cultured in growth medium (Fed) or EBS solution (Starved) for the indicated times, then fixed and observed with a confocal microscope. Cellular DNA was stained with DAPI (blue). Bars, 10 μm. (C) siRNA-treated MCF7 cells were cultured in Fed and Starved conditions for 240 min, and then the cellular lysates were subjected to Western blotting using anti-LC3 and actin antibodies.

Similar articles

Cited by

References

    1. Advani R. J., Bae H. R., Bock J. B., Chao D. S., Doung Y. C., Prekeris R., Yoo J. S., Scheller R. H. Seven novel mammalian SNARE proteins localize to distinct membrane compartments. J. Biol. Chem. 1998;273:10317–10324. - PubMed
    1. Antonin W., Holroyd C., Fasshauer D., Pabst S., Von Mollard G. F., Jahn R. A SNARE complex mediating fusion of late endosomes defines conserved properties of SNARE structure and function. EMBO J. 2000;19:6453–6464. - PMC - PubMed
    1. Atlashkin V., Kreykenbohm V., Eskelinen E. L., Wenzel D., Fayyazi A., Fischer von Mollard G. Deletion of the SNARE vti1b in mice results in the loss of a single SNARE partner, syntaxin 8. Mol. Cell. Biol. 2003;23:5198–5207. - PMC - PubMed
    1. Bright N. A., Gratian M. J., Luzio J. P. Endocytic delivery to lysosomes mediated by concurrent fusion and kissing events in living cells. Curr. Biol. 2005;15:360–365. - PubMed
    1. Cossart P., Sansonetti P. J. Bacterial invasion: the paradigms of enteroinvasive pathogens. Science. 2004;304:242–248. - PubMed

Publication types

MeSH terms

LinkOut - more resources