. 2010 Mar 15;21(6):1097-110.
doi: 10.1091/mbc.e09-08-0655. Epub 2010 Jan 20.

Compartmentalized cyclic adenosine 3',5'-monophosphate at the plasma membrane clusters PDE3A and cystic fibrosis transmembrane conductance regulator into microdomains

Affiliations

Compartmentalized cyclic adenosine 3',5'-monophosphate at the plasma membrane clusters PDE3A and cystic fibrosis transmembrane conductance regulator into microdomains

Himabindu Penmatsa et al. Mol Biol Cell. .

Abstract

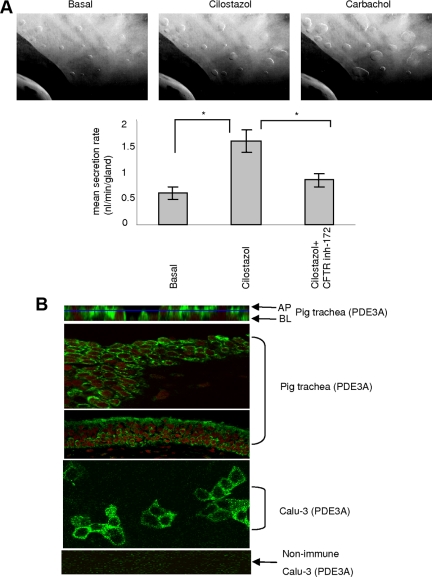
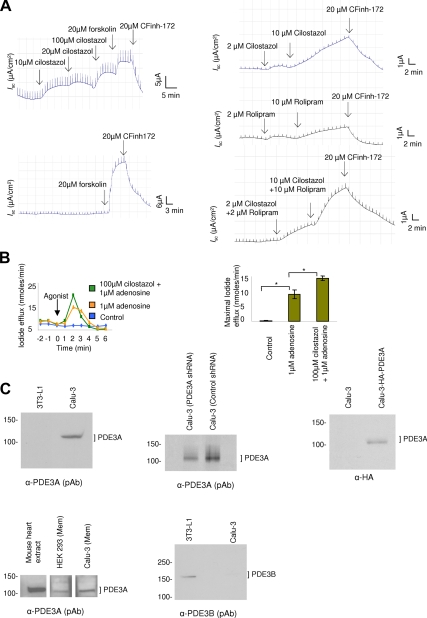
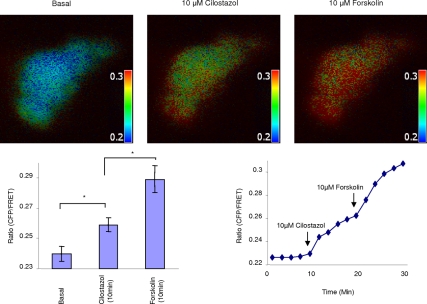
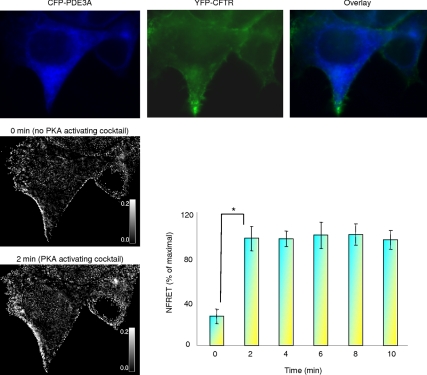
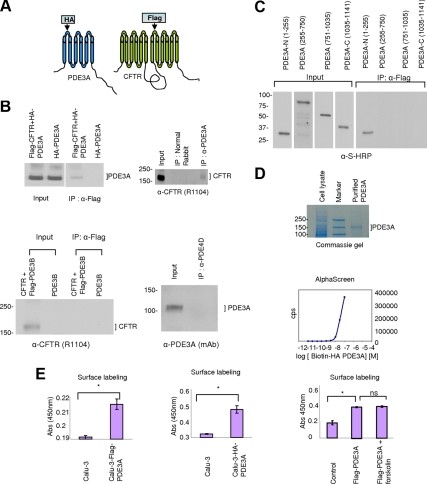
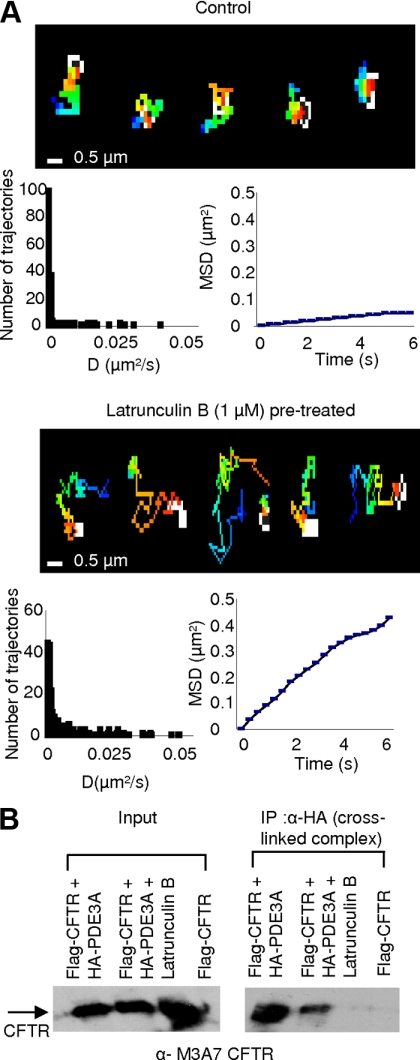
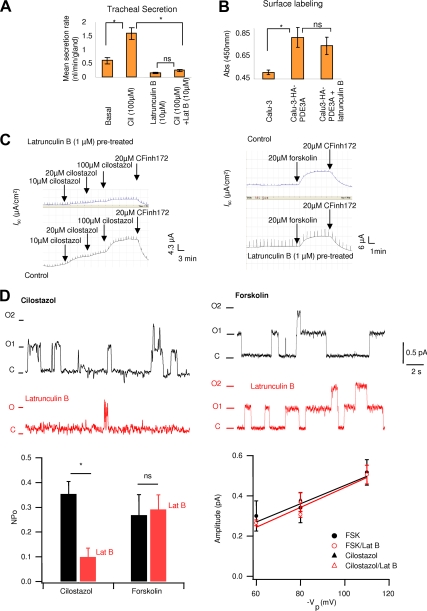
Formation of multiple-protein macromolecular complexes at specialized subcellular microdomains increases the specificity and efficiency of signaling in cells. In this study, we demonstrate that phosphodiesterase type 3A (PDE3A) physically and functionally interacts with cystic fibrosis transmembrane conductance regulator (CFTR) channel. PDE3A inhibition generates compartmentalized cyclic adenosine 3',5'-monophosphate (cAMP), which further clusters PDE3A and CFTR into microdomains at the plasma membrane and potentiates CFTR channel function. Actin skeleton disruption reduces PDE3A-CFTR interaction and segregates PDE3A from its interacting partners, thus compromising the integrity of the CFTR-PDE3A-containing macromolecular complex. Consequently, compartmentalized cAMP signaling is lost. PDE3A inhibition no longer activates CFTR channel function in a compartmentalized manner. The physiological relevance of PDE3A-CFTR interaction was investigated using pig trachea submucosal gland secretion model. Our data show that PDE3A inhibition augments CFTR-dependent submucosal gland secretion and actin skeleton disruption decreases secretion.


Figures

Figure 1.
Figure 1.
PDE3A inhibition augments CFTR function in pig trachea. (A) Representative images of submucosal gland secretion from pig trachea before (basal) and after addition of 100 μM cilostazol (time = 10 min) or 10 μM carbachol (time = 1 min). Bar graph is mean secretion rate ± SEM (n = 3 pigs, 12–35 glands, *p < 0.01) with cilostazol (100 μM) or with both cilostazol (100 μM) and CFTRinh-172 (50 μM). (B) Immunofluorescence micrographs for localization of PDE3A in Calu-3 cells and pig trachea. Apical (AP) and basolateral (BL) are x-z images and the rest are x-y images (green is PDE3A and red is nucleus).
Figure 2.
Figure 2.
PDE3A inhibition augments CFTR function in Calu-3 and HEK293 cells. (A) Representative CFTR-dependent short-circuit currents (Isc) with the addition of PDE3 inhibitor cilostazol (top left panel), or PDE4 inhibitor rolipram (middle right panel), or a combination of cilostazol and rolipram (bottom right panel). Forskolin or CFTRinh-172 was added at the end of the experiment. (B) Representative iodide efflux in HEK293 cells overexpressing CFTR in response to adenosine (±PDE3 inhibitor); bar graphs represent mean maximal iodide efflux at 2 min after adding agonist ± SEM (n = 3–5, *p < 0.01). (C) Immunoblots for PDE3A and PDE3B expression in Calu-3 cells using α-PDE3A pAb (top left panel) and α-PDE3B pAb (bottom right panel). Immunoblot for HA-PDE3A in Calu-3 cells expressing HA-PDE3A using α-HA antibody (top right panel). Immunoblot for PDE3A expression in crude membrane of Calu-3 cells and HEK293 cells using α-PDE3A pAb, mouse heart extract was used as control (bottom left panel). Immunoblot to show PDE3A expression knockdown with PDE3A shRNA in Calu-3 cells (top middle panel).
Figure 3.
Figure 3.
PDE3A inhibition generates compartmentalized cAMP at the plasma membrane of Calu-3 cells. Representative pseudocolor images of CFP/FRET emission ratio before (time = 0 min) and after adding 10 μM cilostazol or 10 μM forskolin (time = 10 min). Look up bar shows magnitude of emission ratio. Line graph is a representative graph for CFP/FRET emission ratio change with time upon adding agonist. Bar graph is mean ratio change ± SEM (n = 6 separate experiments, *p < 0.05).
Figure 4.
Figure 4.
PDE3A interacts with CFTR in live cells in a PKA-dependent manner. Representative direct sensitized FRET between PDE3A and CFTR. HEK293 cells were cotransfected with CFP-PDE3A and YFP-CFTR, and the pseudocolor images show the expression. The intensity of N-FRETc (corrected and normalized) images was presented in monochrome mode, stretched between the low and high renormalization values, according to a temperature-based lookup table, with black indicating low values and white indicating high values. Bar graph is mean percentage of maximal increase in N-FRET ± SEM (n = 6 experiments, 12 regions of interest, and *p < 0.01).
Figure 5.
Figure 5.
PDE3A interacts with CFTR. (A) Pictorial representation of tagged PDE3A and CFTR proteins that were generated with HA or Flag tag on the outer loop. (B) Coimmunoprecipitation of HA-PDE3A and Flag-CFTR in HEK 293 cells (top left panel). Immunoblot for CFTR and PDE3A interaction under native conditions in Calu-3 cells (top right panel). Normal rabbit antibody was used as negative control. Immunoblot for CFTR interaction with Flag-tagged PDE3B under overexpression conditions shows no interaction (bottom left panel). Immunoblot for PDE3A and PDE4D coimmunoprecipitation under native conditions shows no interaction (bottom right panel). (C) Binding assay to determine the minimum domain of PDE3A interacting with CFTR. Input shows different length constructs of PDE3A and coimmunoprecipitation blot shows N-terminal domain of PDE3A interacts with CFTR. (D) AlphaScreen assay to detect binding between full-length Flag-CFTR and full-length biotinylated HA-PDE3A. Graph shows AlphaScreen signal in counts per second (cps) with increasing concentrations of PDE3A (10 pM–100 nM); CFTR concentration was kept constant at 100 nM (n = 3). The Coomassie-stained gel (top panel) shows that full-length biotinylated HA-PDE3A was prepared with high purity. (E) Surface labeling assay to detect the expression of tagged PDE3A in Calu-3 cells. The results show that tagged PDE3A is expressed on the plasma membrane of cells. α-HA-HRP, 0.2 μg/ml, or α-Flag-HRP was used (n = 6, *p < 0.01). The surface expression of PDE3A in Calu-3 cells is unaltered by treatment with PKA-activating agonist forskolin as shown in surface labeling assay (right panel; n = 3, *p < 0.01); ns, not significant.
Figure 6.
Figure 6.
Actin depolymerization alters PDE3A dynamics and its physical coupling with CFTR. (A) SPT of HA-PDE3A in Calu-3 cells. Pseudocolor images show representative trajectories without or with Lat B (1 μM, 10 min) pretreatment. Histograms represent the diffusion coefficients, and MSD plots show representative mean squared displacement kinetics of HA-PDE3A in untreated and Lat B–pretreated cells (n = 6–9 cells, 150–230 trajectories). (B) Coimmunoprecipitation of HA-PDE3A and Flag-CFTR with or without Lat B pretreatment in HEK293 cells. The total protein from cells cotransfected with HA-PDE3A and Flag-CFTR was immunoprecipitated with α-HA beads and immunoblotted for CFTR. The experiment was repeated for three times.
Figure 7.
Figure 7.
Actin depolymerization alters PDE3A dynamics and its functional interaction with CFTR. (A) Submucosal gland secretion from pig trachea before (basal) and after adding cilostazol (100 μM) with or without Lat B (10 μM). Bar graph is mean secretion rate ± SEM (n = 3 pigs, 30–35 glands, *p < 0.01). Student's t test was used within groups, and ANOVA was used between groups. cil, cilostazol; Lat B, Lat B; ns, not significant. (B) Surface expression of PDE3A is unaltered by Lat B pretreatment shown by surface labeling assay (n = 3, *p < 0.05); ns, not significant). (C) Representative CFTR-dependent Isc traces for control and Lat B–pretreated cells showing response to cilostazol (left panel) and forskolin (right panel). (D) Representative single-channel CFTR currents recorded from cell-attached patches in cultured Calu-3 cells at a test potential of +80 mV. The top left current traces are representatives recorded in the presence of 10 μM cilostazol in the pipette solution. Current trace in red was recorded after incubation of the cells.

References

    1. Anderson M. P., Gregory R. J., Thompson S., Souza D. W., Paul S., Mulligan R. C., Smith A. E., Welsh M. J. Demonstration that CFTR is a chloride channel by alteration of its anion selectivity. Science. 1991;253:202–205. - PubMed
    1. Asirvatham A. L., Galligan S. G., Schillace R. V., Davey M. P., Vasta V., Beavo J. A., Carr D. W. A-kinase anchoring proteins interact with phosphodiesterases in T lymphocyte cell lines. J. Immunol. 2004;173:4806–4814. - PubMed
    1. Baillie G. S., Scott J. D., Houslay M. D. Compartmentalisation of phosphodiesterases and protein kinase A: opposites attract. FEBS Lett. 2005;579:3264–3270. - PubMed
    1. Barnes A. P., Livera G., Huang P., Sun C., Oneal W. K., Conti M., Stutts M. J., Milgram S. L. Phosphodiesterase 4D forms a cAMP diffusion barrier at the apical membrane of the airway epithelium. J. Biol. Chem. 2005;280:7997–8003. - PubMed
    1. Barnette M. S. Phosphodiesterase 4 (PDE4) inhibitors in asthma and chronic obstructive pulmonary disease (COPD) Prog. Drug. Res. 1999;53:193–229. - PubMed

Publication types

MeSH terms

LinkOut - more resources