. 2010 Jan 20;30(3):802-19.
doi: 10.1523/JNEUROSCI.1964-09.2010.

Efficient encoding of vocalizations in the auditory midbrain

Affiliations

Efficient encoding of vocalizations in the auditory midbrain

Lars A Holmstrom et al. J Neurosci. .

Abstract

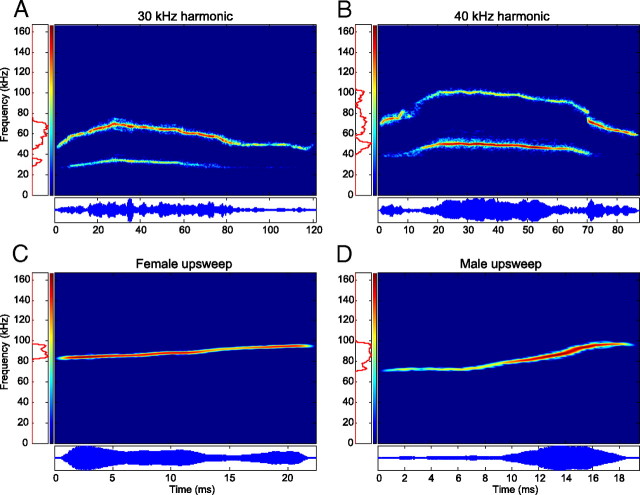
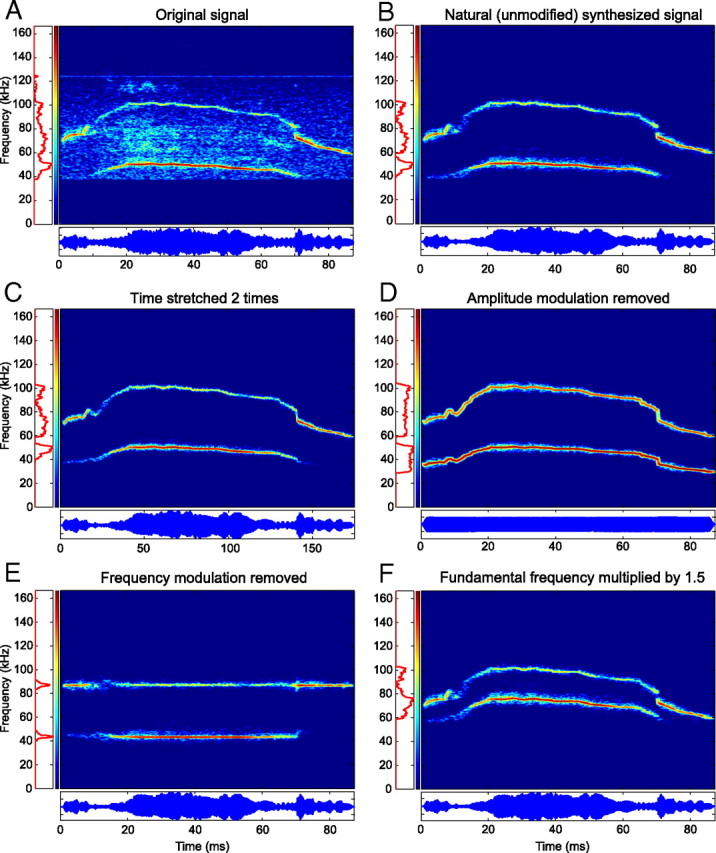
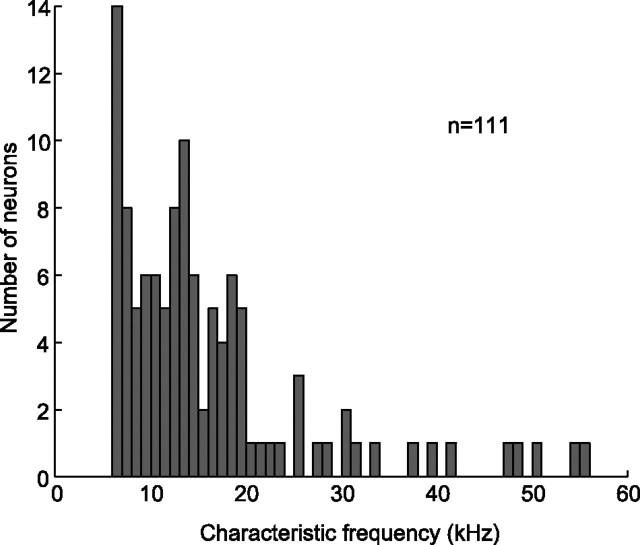
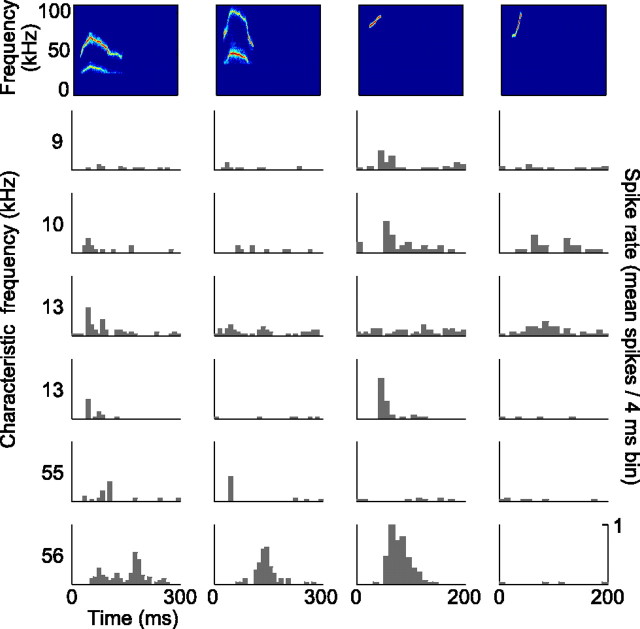
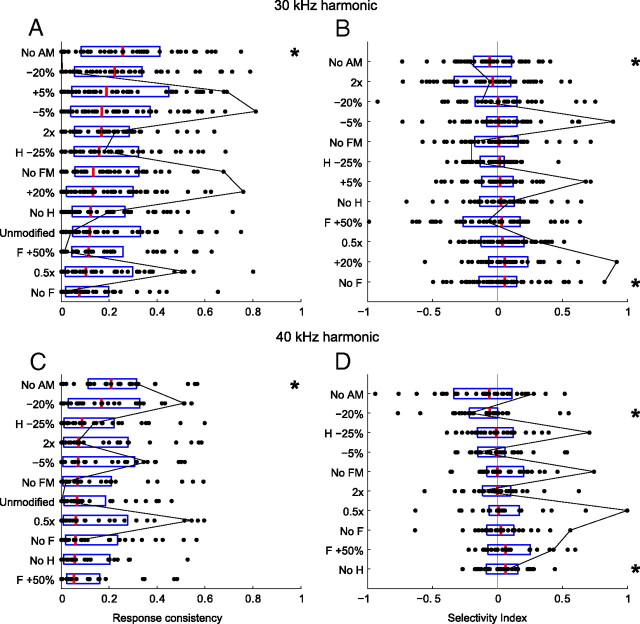
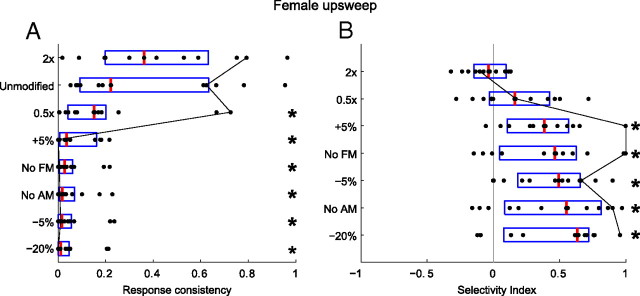
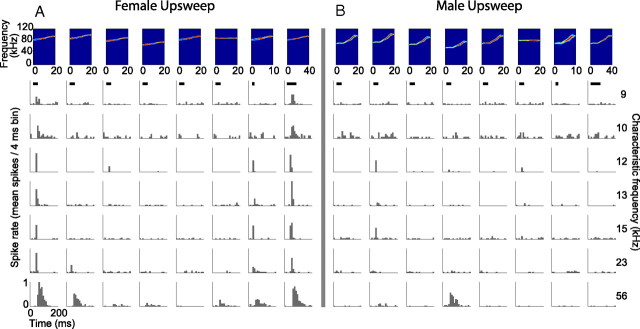
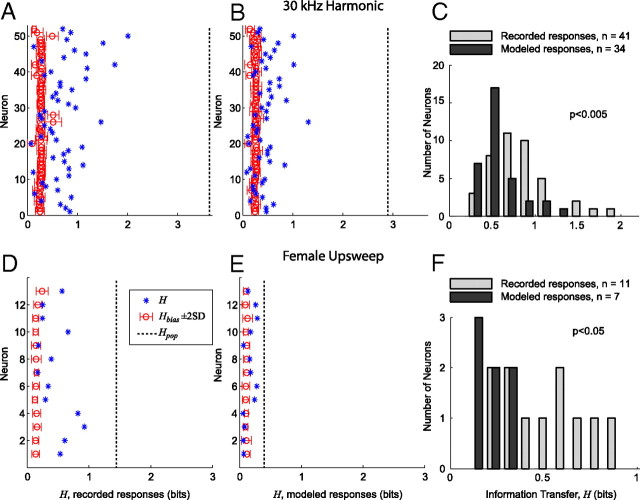
An important question in sensory neuroscience is what coding strategies and mechanisms are used by the brain to detect and discriminate among behaviorally relevant stimuli. There is evidence that sensory systems migrate from a distributed and redundant encoding strategy at the periphery to a more heterogeneous encoding in cortical structures. It has been hypothesized that heterogeneity is an efficient encoding strategy that minimizes the redundancy of the neural code and maximizes information throughput. Evidence of this mechanism has been documented in cortical structures. In this study, we examined whether heterogeneous encoding of complex sounds contributes to efficient encoding in the auditory midbrain by characterizing neural responses to behaviorally relevant vocalizations in the mouse inferior colliculus (IC). We independently manipulated the frequency, amplitude, duration, and harmonic structure of the vocalizations to create a suite of modified vocalizations. Based on measures of both spike rate and timing, we characterized the heterogeneity of neural responses to the natural vocalizations and their perturbed variants. Using information theoretic measures, we found that heterogeneous response properties of IC neurons contribute to efficient encoding of behaviorally relevant vocalizations.


Figures

Figure 1.
Figure 1.
Spectrograms (top) and oscillograms (bottom) of the natural ultrasonic mouse vocalizations used in the study. A, B, and D were recorded during male–female pairings and were most likely emitted by the male, whereas C was emitted by a female in isolation after her pups were removed. All vocalizations were synthesized from the original recordings to remove excessive background noise.
Figure 2.
Figure 2.
Analysis and synthesis of the 40 kHz harmonic vocalization. A, Background noise and small recording artifacts are present in the original recording. B, Synthesis of the signal faithfully regenerated the harmonic content of the vocalization in the absence of the noise present in the original recording. C, Duration doubled without altering the frequency. D, AM removed without altering the FM. E, FM removed without altering the AM. F, An inharmonic vocalization generated by multiplying the fundamental frequency by 150%.
Figure 3.
Figure 3.
Distribution of characteristic frequencies. Only 10% (n = 12) of the neurons had characteristic frequencies in the range of the ultrasonic vocalizations presented in this study, yet 54% (n = 60) of the neurons responded to one or more vocalizations (natural or modified).
Figure 4.
Figure 4.
PSTHs of six representative neurons in response to the natural vocalizations. The spectrograms of the vocalizations are displayed at the top. The characteristic frequency of each neuron is indicated on the left of each row of responses. Each of the vocalizations elicited a response in a subset of the neurons, and the responses were heterogeneous with respect to discharge rates and patterns. Even neurons with similar CFs responded differently to the vocalizations (middle rows).
Figure 5.
Figure 5.
Example of pure tone modeling of a neuron from this study. The output of the model approximates the expected response to arbitrary stimuli assuming that the pure tone responses can be used to characterize the response properties of the neuron. A, The FRA of the neuron, showing a tuning range between 7 and 35 kHz. B, A visualization of the parameterization of the model, which can be interpreted as an STRF. The vocalization stimuli were converted into a spectrographic representation and convolved with the model to generate the predicted response. C, The actual and predicted responses to the 30 kHz harmonic vocalization. The model predicted a response that was an accurate representation of the recorded response. D, The actual and predicted responses to the 40 kHz harmonic vocalization. In this case, there was no overlap between the frequency of the vocalization and the FRA of the neuron, and the model accurately predicted the absence of a response. E, The actual and predicted responses to the female upsweep vocalization. Because the frequency content of the vocalization does not overlap with the FRA of the neuron, the model again predicted the absence of a response. In this case, the neuron unexpectedly had a strong response to the vocalization that cannot be explained by its pure tone responses.
Figure 6.
Figure 6.
Altering the spectral content of the vocalizations explained the change in responsiveness in some neurons. (AC) The FRAs of 3 different neurons had little or no overlap with the natural 30 kHz harmonic vocalization. (D, F, and H) Low response consistencies to the natural vocalization are indicated by the low values for RXN. (E, G, and I) Each of the neurons responded reliably to a modified version of this vocalization, as indicated by the high values of RXM and the negative values of the selectivity index D. The responses in E and G resulted from the introduction of power in the FRA of the corresponding neuron when the vocalization was modified, as indicated by the close fit of the pure tone model predictions to the actual neural response. The FRA of the neuron in I does not contribute to the robust response, as attested the by lack of response predicted by the model. Nonlinear cochlear amplification of the different spectral components could result in the production of a difference tone, explaining the response.
Figure 7.
Figure 7.
AM and FM are important features for creating selective neural responses. A, B, The FRAs of two neurons. C, This neuron consistently responded to the natural 40 kHz harmonic vocalization (RXN = 0.40), which was predicted by the pure tone model. D, The lack of response to the no-AM variant is indicated by the reduced RXM value, low response similarity (SXY = 0.02), and large, positive selectivity index (D = 0.37). The predicted response was also attenuated as a result of increased power introduced into the inhibitory sideband captured by the model. E, This neuron showed a robust response to the natural 30 kHz vocalization, which was not captured by the model because the spectral power of the vocalization lies outside the FRA of the neuron. F, The response was significantly reduced after removal of the FM from this vocalization.
Figure 8.
Figure 8.
Vocalization duration modulates the responses of neurons in the IC. A–C, Responses to the time compressed (half as long; left column), natural (middle column), and time-stretched (twice as long; right column) 40 kHz harmonic vocalization are shown for three neurons. The neuron in A was selective for the stretched variant (RXM = 0.54 and D = −0.63), although the pure tone model predicts no response to this variant. The neurons in B and C displayed consistent responses regardless of the duration of the stimulus (RX ranges from 0.55 to 0.60), resulting in low values of D. However, both of these neurons shifted the timing of the response in accordance with the duration of the vocalization (SXY ≤ 0.25). Note that the neuron in C displayed a sustained inhibitory response and that the inhibitory rebound is most apparent in response to the natural vocalization.
Figure 9.
Figure 9.
A, C, Population response consistencies (RX) for neurons responding to at least one variant of the 30 kHz (A) or 40 kHz (C) harmonic vocalization, sorted from most consistent (top) to least consistent (bottom). B, D, Population selectivity indices (D), sorted from least selective to the natural vocalization (top) to most selective (bottom). Box plots indicate the range of the second and third quartile of the distribution along with the median. The black line connects the metric values for a single neuron across the vocalization variants, indicating how variable a single neuron may be to perturbations in the vocalization characteristics. There is evidence of significant heterogeneity in the responses to the vocalizations from both a spike timing (A, C) and a spike rate (B, D) perspective. Except for the no-AM variant, mean response consistencies did not differ significantly from the responses to the natural vocalizations (similar temporal jitter), nor was there a significant difference in mean spike rate between the responses to the natural vocalizations and most modified vocalizations. * indicates distributions that were significantly different from the distribution of the natural variant (two-sample Kolmogorov–Smirnov test, α = 0.05).
Figure 10.
Figure 10.
A, Population response consistencies (RX) for neurons responding to at least one variant of the female upsweep vocalization, sorted from most consistent (top) to least consistent (bottom). B, Population selectivity indices (D), sorted from least selective to the natural vocalization (top) to most selective (bottom). Box plots indicate the range of the second and third quartile of the distribution along with the median. The black line connects the metric values for a single neuron across the vocalization variants. There is significant evidence of population selectivity to the natural vocalizations from both a spike timing (A) and a spike rate (B) perspective. With the exception of the stretched variant, response consistency values differed significantly from the responses to the natural vocalizations (more temporal jitter), and there were significant differences in mean spike rate between the responses to the natural vocalizations and the modified vocalizations. * indicates distributions that were significantly different from the distribution of the natural variant (two-sample Kolmogorov–Smirnov test, α = 0.05).
Figure 11.
Figure 11.
Specific examples of responses to variants of the female (A) and male (B) upsweep vocalizations showing that the neural population was selective to the natural (A, first column) and time-stretched (A, last column) variants of the female upsweep vocalization. The spectrograms of the vocalizations are displayed across the top in the following order: natural, +5%, −5%, −20%, no AM, no FM, time compressed, time stretched. The characteristic frequency of each neuron is displayed on the right. Neurons with a wide range of CFs responded to the female upsweep vocalization, although its spectral content is far outside the FRA of each neuron and the pure tone models predicted no response. Despite the similarity in duration and spectral content to the female upsweep vocalization, the natural male upsweep vocalization did not elicit substantial responses in the neuron population, and very few neurons responded to any of its variants.
Figure 12.
Figure 12.
IC neurons use a more efficient encoding strategy for discrimination among vocalizations than an encoding strategy based on modeled responses by lower auditory nuclei. A, Information transfer (H) between stimuli and responses for each neuron that responded to at least one of the 30 kHz harmonic vocalization variants. The open circle and error bars indicate bias + 2 SD. The x-axis spans the bounds of H [(0 log2Nvocs) bits]. The dashed line indicates Hpop, the information transfer of the neural population as a whole. B, H for each neuron measured from the modeled responses to the 30 kHz harmonic vocalization variants. C, Histogram comparing the recorded and modeled distributions of H for the neurons with significant information transfer (bias + 2 SD). H for the recorded data is significantly greater than H for the modeled data (two-sample Kolmogorov–Smirnov test, p < 0.005). D, H between stimuli and response for each neuron that responded to at least one of the female upsweep vocalization variants. E, H for each neuron measured from the modeled responses to the female upsweep vocalization variants. F, Histogram comparing the recorded and modeled distributions of H for the neurons with significant information transfer (bias + 2 SD). H for the recorded data is significantly greater than H for the modeled data (two-sample Kolmogorov–Smirnov test, p < 0.05).
Figure 13.
Figure 13.
IC responses are more heterogeneous to a given vocalization than is predicted by modeled responses from lower auditory nuclei. A, Information transfer (H) for each variant of the 30 kHz harmonic vocalization, measured across all neurons that responded to at least one of the variants. The open circle and error bars indicate bias + 2 SD. The x-axis spans the bounds of H [(0 log2Nneurons) bits]. B, H for each variant of the 30 kHz harmonic vocalization using the responses modeled from the pure tone response properties of each neuron. C, Histogram comparing the recorded and modeled distributions of H for the vocalization variants with significant information transfer (bias + 2 SD). H for the recorded data is significantly greater than H for the modeled data (two-sample Kolmogorov–Smirnov test, p < 0.001). D, Information transfer (H) for each variant of the female upsweep vocalization, measured across all neurons that responded to at least one of the variants. The three variants with the elevated values of H are as follows: natural (bottom), time stretched, and time compressed (top). E, H for each variant of the female upsweep vocalization using the responses modeled from the pure tone response properties of each neuron. F, Histogram comparing the recorded and modeled distributions of H for the vocalization variants with significant information transfer (bias + 2 SD). H for the recorded data and H for the modeled data are not significantly different. This is primarily attributable to the small sample size (n = 8).

Similar articles

Cited by

References

    1. Abel C, Kössl M. Sensitive response to low frequency cochlear distortion products in the auditory midbrain. J Neurophysiol. 2009;101:1560–1574. - PubMed
    1. Adams JC. Ascending projections to the inferior colliculus. J Comp Neurol. 1979;183:519–538. - PubMed
    1. Aertsen AM, Johannesma PI. The spectro-temporal receptive field: a functional characteristic of auditory neurons. Biol Cybern. 1981;42:133–143. - PubMed
    1. Amin N, Doupe A, Theunissen FE. Development of selectivity for natural sounds in the songbird auditory forebrain. J Neurophysiol. 2007;97:3517–3531. - PubMed
    1. Andoni S, Li N, Pollak GD. Spectrotemporal receptive fields in the inferior colliculus revealing selectivity for spectral motion in conspecific vocalizations. J Neurosci. 2007;27:4882–4893. - PMC - PubMed

Publication types

LinkOut - more resources