. 2010 Jan 20;30(3):838-48.
doi: 10.1523/JNEUROSCI.3116-09.2010.

Neural integration of information specifying human structure from form, motion, and depth

Affiliations

Neural integration of information specifying human structure from form, motion, and depth

Stuart Jackson et al. J Neurosci. .

Abstract

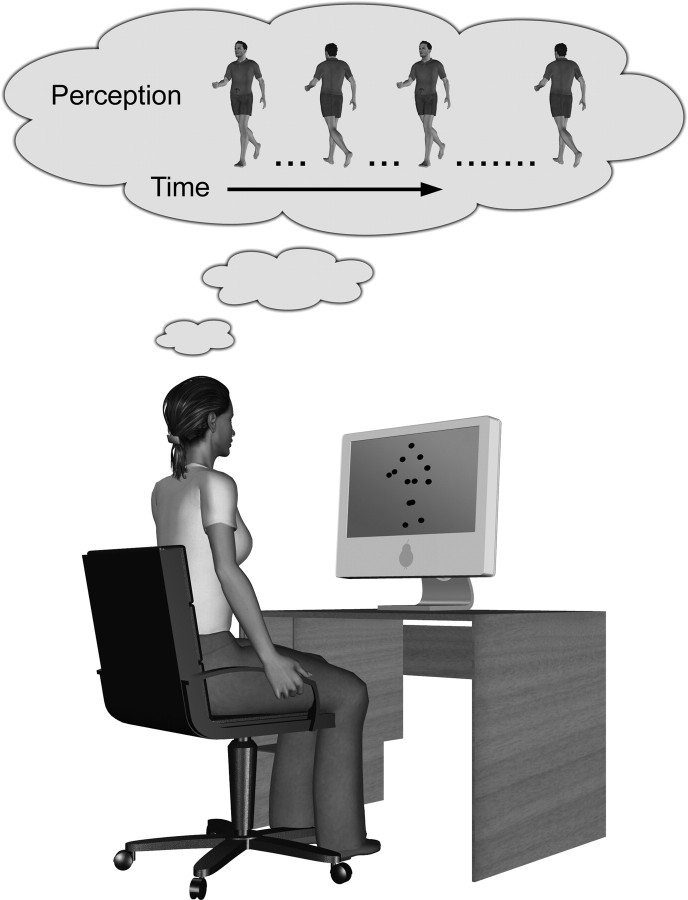
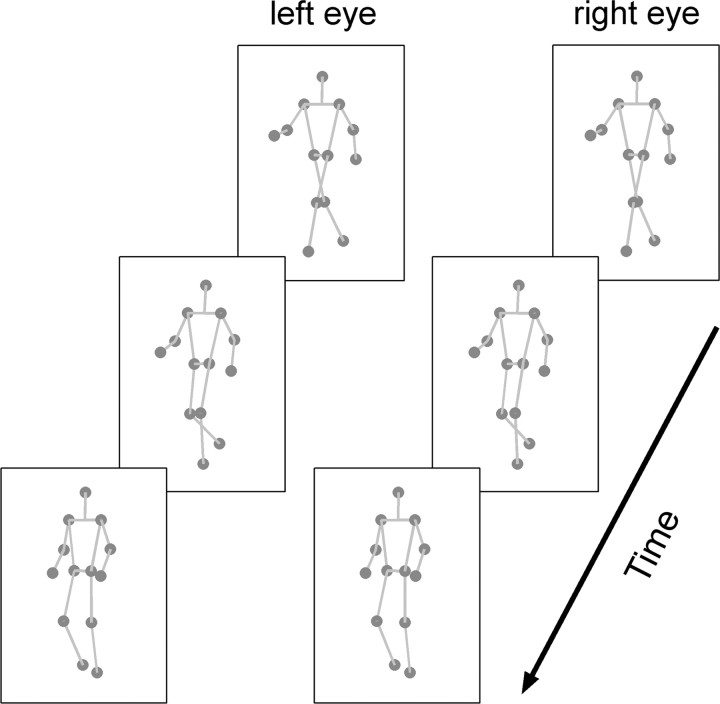
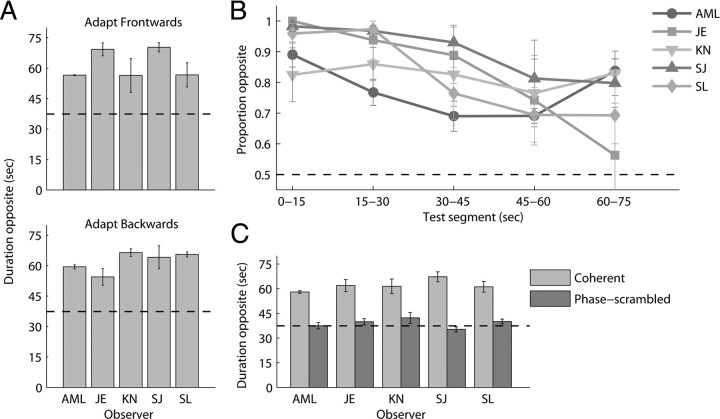
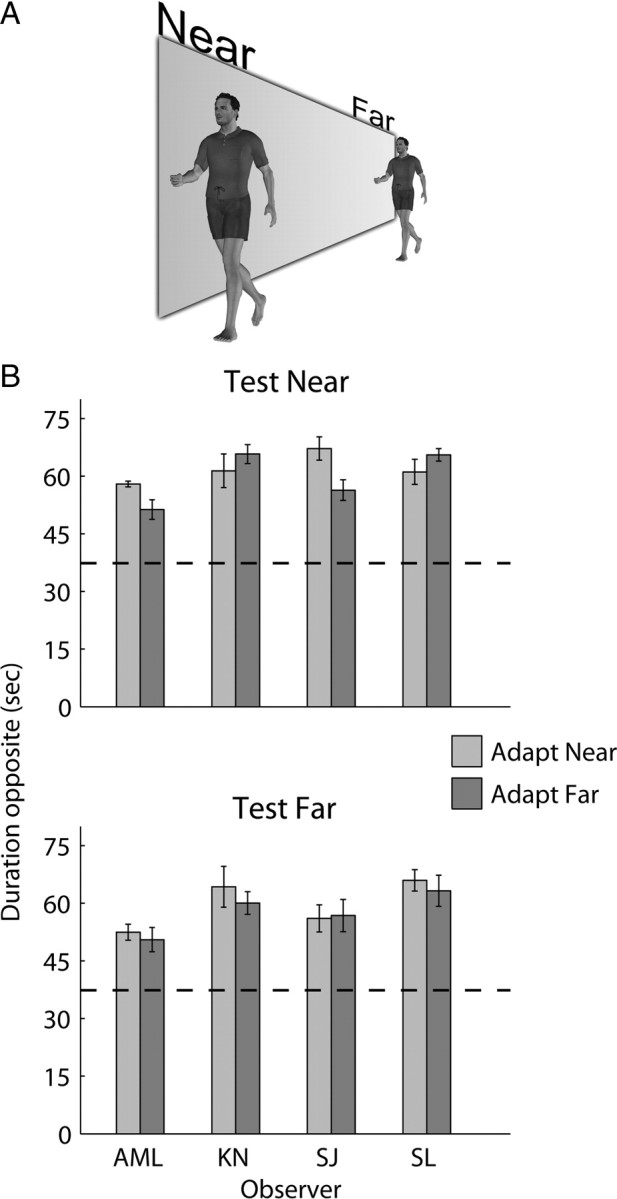
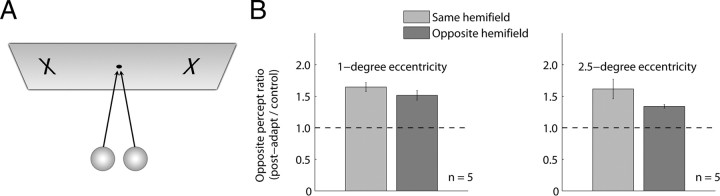
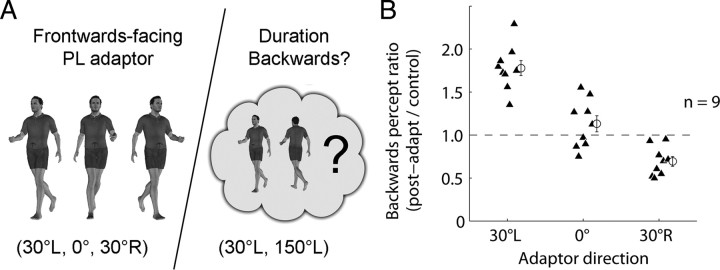
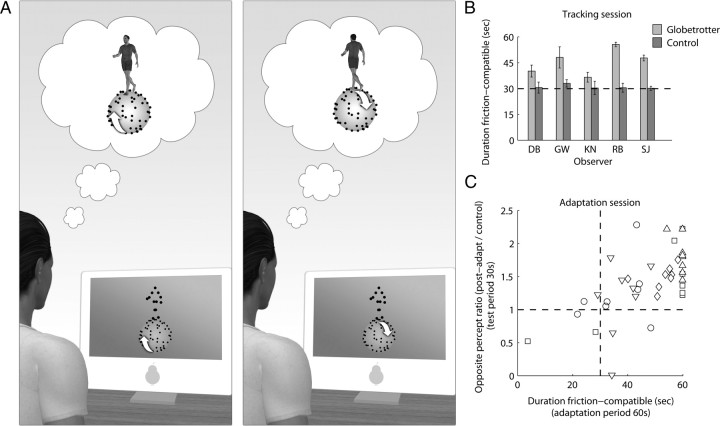
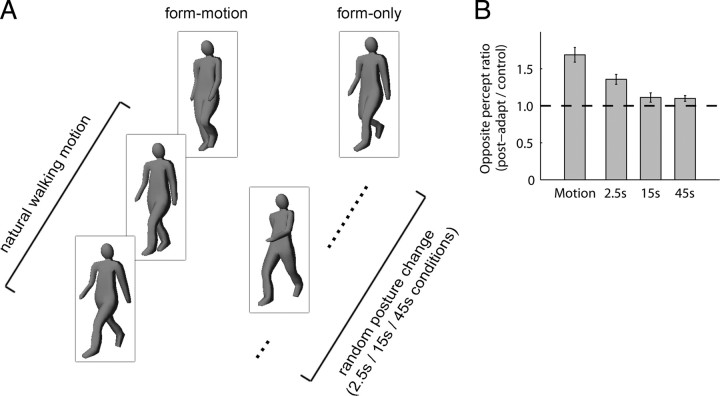
Recent computational models of biological motion perception operate on ambiguous two-dimensional representations of the body (e.g., snapshots, posture templates) and contain no explicit means for disambiguating the three-dimensional orientation of a perceived human figure. Are there neural mechanisms in the visual system that represent a moving human figure's orientation in three dimensions? To isolate and characterize the neural mechanisms mediating perception of biological motion, we used an adaptation paradigm together with bistable point-light (PL) animations whose perceived direction of heading fluctuates over time. After exposure to a PL walker with a particular stereoscopically defined heading direction, observers experienced a consistent aftereffect: a bistable PL walker, which could be perceived in the adapted orientation or reversed in depth, was perceived predominantly reversed in depth. A phase-scrambled adaptor produced no aftereffect, yet when adapting and test walkers differed in size or appeared on opposite sides of fixation aftereffects did occur. Thus, this heading direction aftereffect cannot be explained by local, disparity-specific motion adaptation, and the properties of scale and position invariance imply higher-level origins of neural adaptation. Nor is disparity essential for producing adaptation: when suspended on top of a stereoscopically defined, rotating globe, a context-disambiguated "globetrotter" was sufficient to bias the bistable walker's direction, as were full-body adaptors. In sum, these results imply that the neural signals supporting biomotion perception integrate information on the form, motion, and three-dimensional depth orientation of the moving human figure. Models of biomotion perception should incorporate mechanisms to disambiguate depth ambiguities in two-dimensional body representations.


Figures

Figure 1.
Figure 1.
Bistable biological motion. The schematic illustrates how a standard PL walker can be perceived with either of two heading directions; in the experiments reported in this paper, observers viewed a bistable PL walker that could be perceived as facing 30° left (frontward-facing) or 150° left (backward-facing) of the observer's line of sight.
Figure 2.
Figure 2.
Stereo presentation of a PL walker. To disambiguate the PL walker's direction for the adaptation experiments, observers viewed image sequences generated separately for the left and right eyes. These were presented by means of a mirror stereoscope. Each image sequence depicted identical walking motions, although with a slight orientation disparity between the eyes, mimicking the fact that the left and right eyes have slightly rotated viewpoints onto an object in the real world. By cross-fusing the images in this figure, readers can perceive a frontward-facing figure rotated 30° left (i.e., as though facing beyond the reader's left shoulder). In the actual experiments, walkers were presented as black dots on a gray background, inside patterned fusion frames. Here, sticks are presented on the PL figure for illustration only.
Figure 3.
Figure 3.
Adaptation aftereffects with bistable biomotion. A, Plots present the mean number of seconds of the 75 s test period during which the perceived heading of the PL walker was opposite to that experienced during adaptation (n = 5). The bars represent the mean of four trials per adapting direction. Results from frontward adaptor (top) and backward adaptor (bottom) trials are given separately. The aftereffect was equally strong for both adaptor types (t(4) = −0.034; p = 0.97). B, Proportion dominance of the opposite percept during consecutive 15 s segments of the 75 s test period. The curves present the mean of eight trials for each observer, collapsed across adapting direction. C, Mean total duration of the opposite percept (collapsed across directions) after adaptation to the stereo-defined walker and to the phase-scrambled walker. For all observers, the aftereffect disappeared when phase-scrambling was introduced in the adaptor (t(4) = 10.02; p < 0.001). The horizontal dashed lines indicate an equal total duration (or equal proportion) for same/opposite percepts. Error bars represent ±1 SE throughout.
Figure 4.
Figure 4.
Scale invariance of the aftereffect. A, Illustration of the relative size and implied distance of stimuli used in the scale invariance experiment; note that the actual experimental stimuli were PL walkers. In different trials, observers adapted to a near walker (3.5 dva tall) and tested with an ambiguous far walker (1.75 dva tall); in others trials, the opposite occurred. B, Mean total duration of the opposite percept, collapsed across adapting directions. Results are also presented for adapt near/test near and adapt far/test far trials for comparison. The bars represent the mean of eight trials per condition. Comparing conditions in which the test stimuli were kept identical, no significant differences were found between adapt near and adapt far conditions (test near: t(3) = 0.56, p = 0.62; test far: t(3) = 1.97, p = 0.14). The horizontal dashed lines indicate an equal total duration for same/opposite percepts. Error bars represent ±1 SE.
Figure 5.
Figure 5.
Position invariance of the aftereffect. A, Schematic illustrating the eccentric placement of adapt/test walkers (see Materials and Methods). B, Opposite percept ratio averaged across observers at 1° (left; n = 5) and 2.5° (right; n = 5) eccentricities. Three observers took part in both conditions. Ratio measures were calculated by dividing the duration of the opposite percept after adaptation by the mean duration of that percept when presented in tracking trials at the eccentric location (i.e., separate denominators for left-side and right-side test locations). The horizontal dashed lines indicate a postadapt/control ratio of 1 (i.e., no adaptation). Error bars represent ±1 SE computed across observer means. At 1°, no main effect was found for test location relative to adapt location (i.e., the aftereffect transferred across hemifield) (F(1,4) = 3.02; p = 0.16). No other main effects or interactions were significant. Although aftereffects were equivalent for same/opposite hemifield presentation at 1° (and equivalent in magnitude to trials in which both stimuli appeared at fixation) (data not shown), on average aftereffects transferred less strongly across hemifield in the 2.5° eccentricity condition. The main effect for same/opposite hemifield, however, was not significant (F(1,4) = 2.36; p = 0.2), although this lack of significance may have resulted from the presence of one outlier dataset. Analyses revealed a significant interaction between adaptor direction and same/opposite hemifield presentation (F(1,4) = 11.8; p < 0.05) and a trend toward interaction between adapt side (left/right) and same/opposite hemifield presentation (F(1,4) = 7.13; p = 0.056). See Results for discussion.
Figure 6.
Figure 6.
Tuning of the aftereffect to heading orientation. A, Orientation tuning of the aftereffect was studied by adapting observers (n = 9) to one of three frontward-facing walkers in separate blocked trials (see Materials and Methods). The test stimulus was always the same bistable PL walker (30° left/150° left). B, Backward percept ratio measures for each observer. The horizontal dashed line indicates a postadapt/control ratio of 1 (i.e., no adaptation). Analyses revealed a strong effect of adaptor type (F(2,16) = 94.6; p < 10−9). Post hoc tests confirmed that the aftereffect fell off significantly from the 30°L to 0° adaptors (t(8) = 7.4; p < 0.0001), and from 0° to 30°R adaptors (t(8) = 5.9; p < 0.0005).
Figure 7.
Figure 7.
Context-disambiguation and adaptation. A, Locating the bistable PL walker on top of a stereo-defined, rotating globe created conditions that promoted stabilization of the bistable walker's perceived direction toward the friction-compatible percept. In the actual experiment, observers viewed the disparity-free walker and stereo globe through a mirror stereoscope; stimuli were presented as white dots on a gray background. B, Mean friction-compatible durations for globetrotter trials and randomly matched control trials (static globe) in the tracking session (see Materials and Methods). The bars represent the mean of eight 60 s tracking trials. With the moving stereo globe, observers (n = 5) experienced the friction-compatible percept for significantly longer durations than in control trials (t(4) = 4.5; p < 0.05). The horizontal dashed line indicates an equal total duration for friction-compatible/incompatible percepts. Error bars represent ±1 SE. C, In the adaptation session, observers completed 60 s tracking periods, which were immediately followed by 30 s tracking of the bistable walker alone. Control trials consisted of adaptation to the stereo globe alone, followed by 30 s test with the bistable walker. For each trial, the x-axis depicts the total time during the adapt period (60 s) in which the bistable walker was perceived in the friction-compatible mode; on the y-axis, a ratio measure is given, calculated as the total time in which the opposite percept was perceived during the 30 s test period divided by the corresponding measure from the control trials. This ratio measure controls for the possibility that adaptation resulted from stereo signals provided by the globe, as well as ensuring a pure measure of adaptation free of individual observer biases (e.g., observer DB experienced prolonged dominance of frontward walking in many trials). The vertical dashed line indicates an equal total duration for friction-compatible/incompatible percepts during the 60 s adapt period; the horizontal dashed line indicates a postadapt/control ratio of 1 for the test period (i.e., no adaptation).
Figure 8.
Figure 8.
Transfer of adaptation across stimulus type. A, Observers completed trials adapting (45 s) to a full-body walker (form-motion) or to sequences of random, static postures taken from the same walking sequence (form-only). During form-only trials, the random posture was replaced with another static posture every 2.5 s, 15 s, or not at all (45 s condition). After adaptation, observers tracked (30 s) the perceived direction of a bistable PL walker as usual. Observers completed control trials in which the adaptation period consisted of fixating only the fixation cross over a blank background. B, Mean opposite percept ratio measures across observers (n = 5), calculated by dividing the duration of the opposite percept after adaptation by the mean duration of that percept in control trials. A repeated-measures ANOVA revealed a strong effect of adaptor type (F(3,12) = 30.03; p < 10−6). For the form-motion and 2.5 s conditions, observers had on average larger ratio measures for frontward-facing adaptor trials leading to a small interaction (F(3,12) = 3.94; p < 0.05). This was most likely related to the tendency in observers tested for smaller backward-percept denominators. Data are collapsed across adapting direction as a similar trend was apparent for both frontward and backward adaptor trials. Post hoc tests confirmed that the aftereffect was significantly stronger for the form-motion condition than for the form-only (2.5 s) adaptor (t(4) = 5.3; p = 0.0059), or for either of the mostly static adaptors (both p < 0.005). A modest aftereffect in the PL walker's direction was experienced when observers adapted to static postures that alternated every 2.5 s, although with Bonferroni's correction for multiple comparisons this was only marginally significant (compared with 45 s condition: t(4) = 3.5, p = 0.025; compared with 15 s condition: t(4) = 4.6, p = 0.0098). The horizontal dashed line indicates a postadapt/control ratio of 1 (i.e., no adaptation). Error bars represent ±1 SE computed across observer means.

Similar articles

Cited by

References

    1. Barraclough NE, Xiao D, Oram MW, Perrett DI. The sensitivity of primate STS neurons to walking sequences and to the degree of articulation in static images. Prog Brain Res. 2006;154:135–148. - PubMed
    1. Battelli L, Cavanagh P, Thornton IM. Perception of biological motion in parietal patients. Neuropsychologia. 2003;41:1808–1816. - PubMed
    1. Blake R, Shiffrar M. Perception of human motion. Annu Rev Psychol. 2007;58:47–73. - PubMed
    1. Blakemore C, Julesz B. Stereoscopic depth aftereffect produced without monocular cues. Science. 1971;171:286–288. - PubMed
    1. Blakemore C, Sutton P. Size adaptation: a new aftereffect. Science. 1969;166:245–247. - PubMed

Publication types

LinkOut - more resources