

Molecular identity of periglomerular and short axon cells
- PMID: 20089927
- PMCID: PMC3718026
- DOI: 10.1523/JNEUROSCI.3497-09.2010
Molecular identity of periglomerular and short axon cells
Abstract
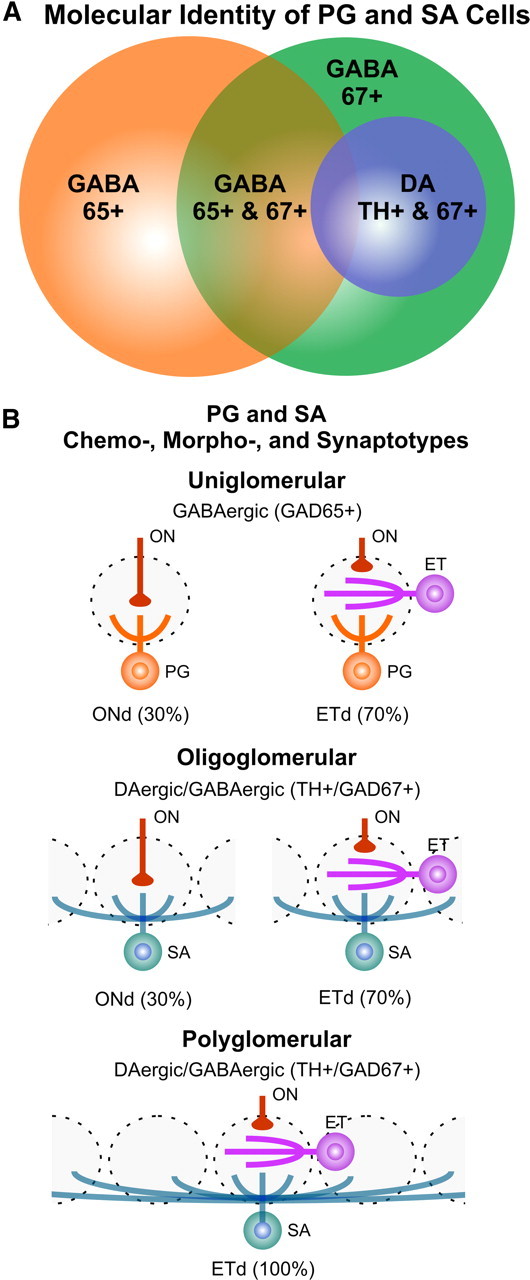
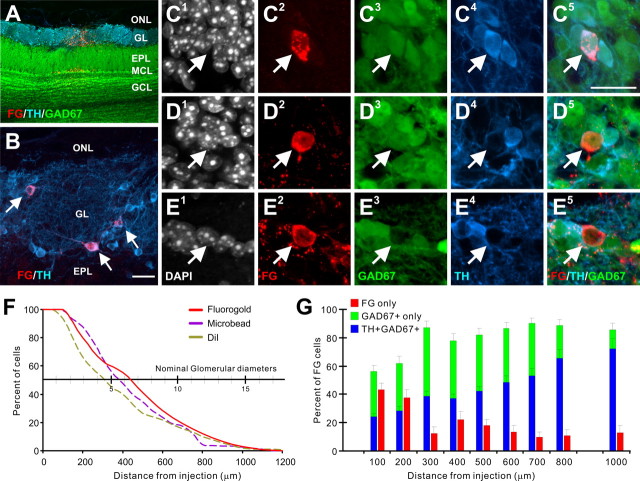
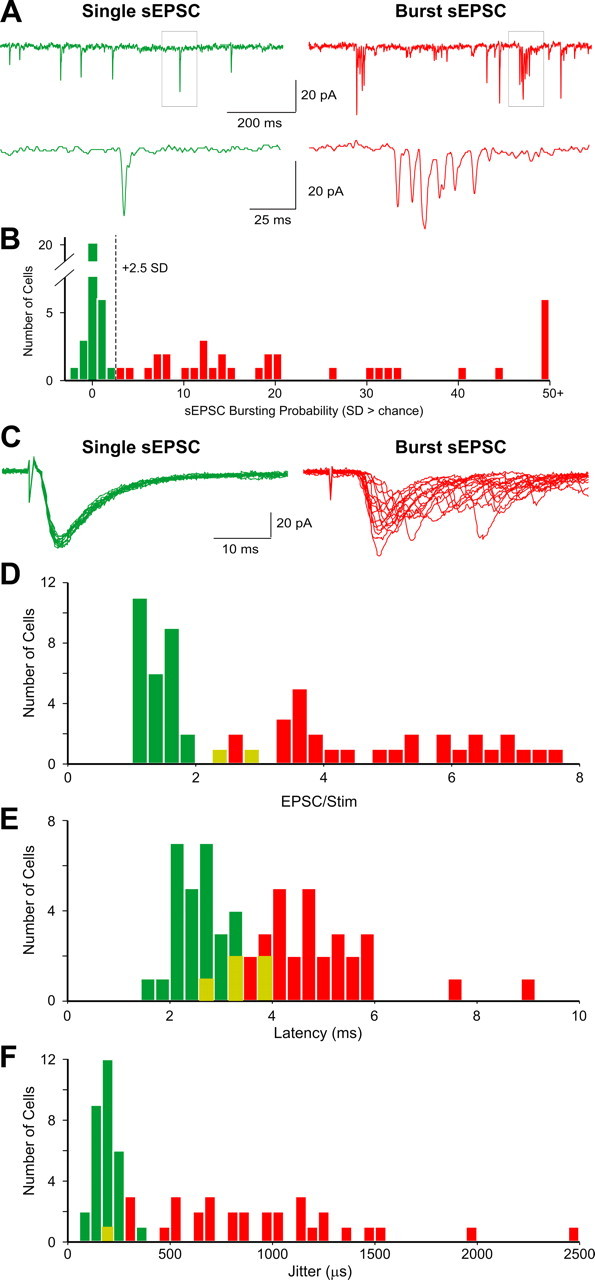
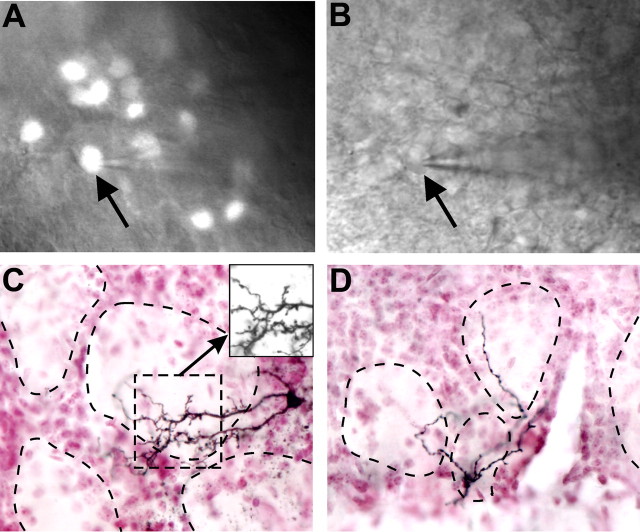
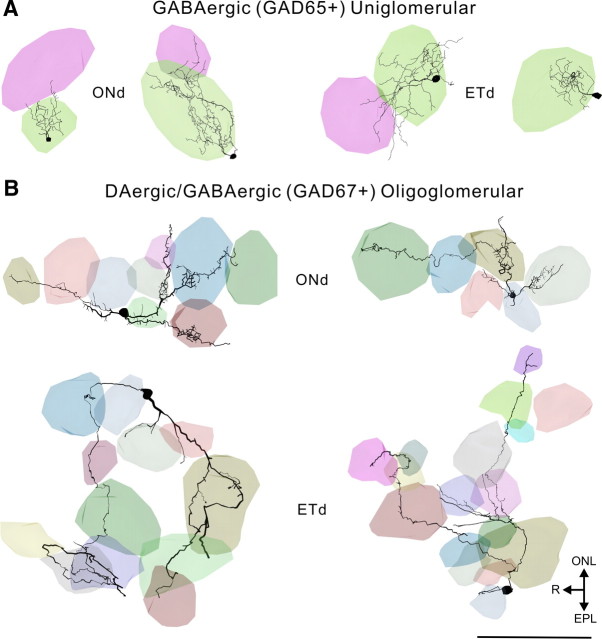
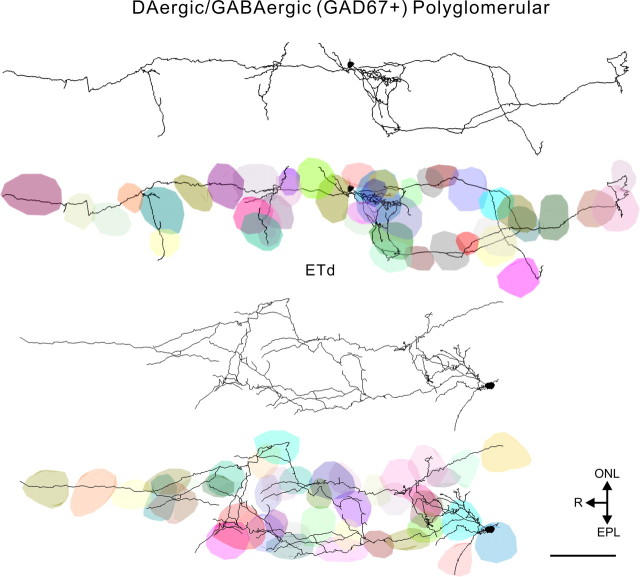
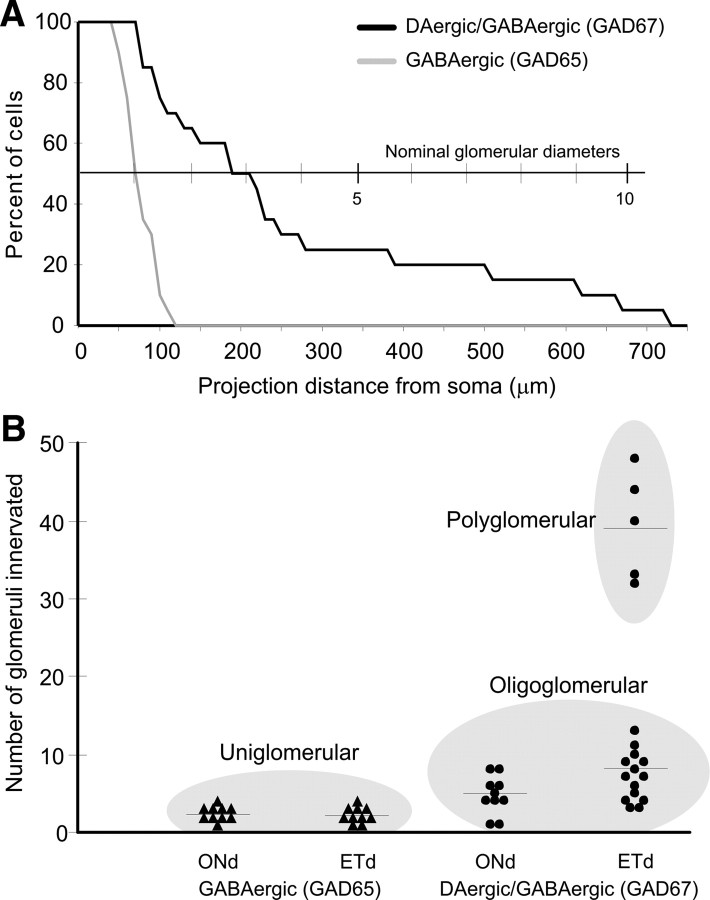
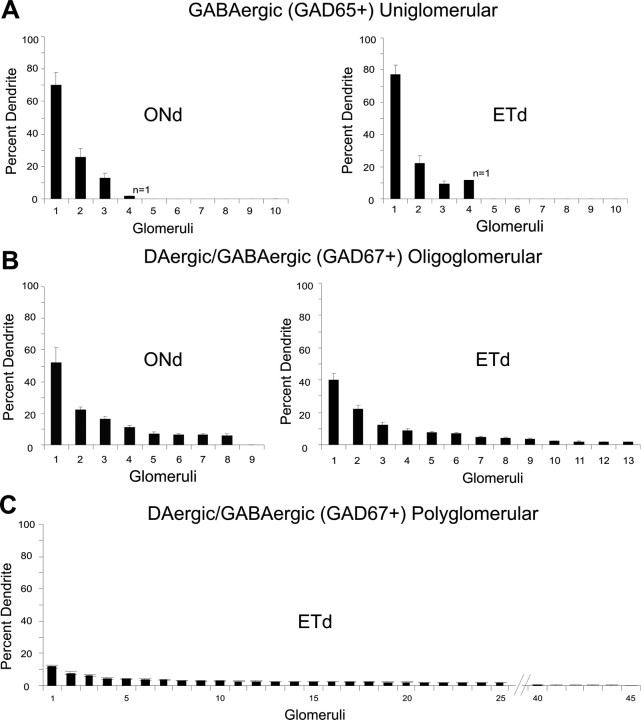
Within glomeruli, the initial sites of synaptic integration in the olfactory pathway, olfactory sensory axons terminate on dendrites of projection and juxtaglomerular (JG) neurons. JG cells form at least two major circuits: the classic intraglomerular circuit consisting of external tufted (ET) and periglomerular (PG) cells and an interglomerular circuit comprised of the long-range connections of short axon (SA) cells. We examined the projections and the synaptic inputs of identified JG cell chemotypes using mice expressing green fluorescent protein (GFP) driven by the promoter for glutamic acid decarboxylase (GAD) 65 kDa, 67 kDa, or tyrosine hydroxylase (TH). Virtually all (97%) TH+ cells are also GAD67+ and are thus DAergic-GABAergic neurons. Using a combination of retrograde tracing, whole-cell patch-clamp recording, and single-cell three-dimensional reconstruction, we show that different JG cell chemotypes contribute to distinct microcircuits within or between glomeruli. GAD65+ GABAergic PG cells ramify principally within one glomerulus and participate in uniglomerular circuits. DAergic-GABAergic cells have extensive interglomerular projections. DAergic-GABAergic SA cells comprise two subgroups. One subpopulation contacts 5-12 glomeruli and is referred to as "oligoglomerular." Approximately one-third of these oligoglomerular DAergic SA cells receive direct olfactory nerve (ON) synaptic input, and the remaining two-thirds receive input via a disynaptic ON-->ET-->SA circuit. The second population of DAergic-GABAergic SA cells also disynaptic ON input and connect tens to hundreds of glomeruli in an extensive "polyglomerular" network. Although DAergic JG cells have traditionally been considered PG cells, their interglomerular connections argue that they are more appropriately classified as SA cells.
Figures
Similar articles
-
Two GABAergic intraglomerular circuits differentially regulate tonic and phasic presynaptic inhibition of olfactory nerve terminals.J Neurophysiol. 2009 Apr;101(4):1988-2001. doi: 10.1152/jn.91116.2008. Epub 2009 Feb 18. J Neurophysiol. 2009. PMID: 19225171 Free PMC article.
-
Sensory experience selectively regulates transmitter synthesis enzymes in interglomerular circuits.Brain Res. 2011 Mar 25;1382:70-6. doi: 10.1016/j.brainres.2011.01.068. Epub 2011 Jan 26. Brain Res. 2011. PMID: 21276774 Free PMC article.
-
Spatial distribution of synapses on tyrosine hydroxylase-expressing juxtaglomerular cells in the mouse olfactory glomerulus.J Comp Neurol. 2017 Apr 1;525(5):1059-1074. doi: 10.1002/cne.24147. Epub 2017 Jan 10. J Comp Neurol. 2017. PMID: 27864931
-
Intraglomerular lateral inhibition promotes spike timing variability in principal neurons of the olfactory bulb.J Neurosci. 2015 Mar 11;35(10):4319-31. doi: 10.1523/JNEUROSCI.2181-14.2015. J Neurosci. 2015. PMID: 25762678 Free PMC article.
-
Detecting activity in olfactory bulb glomeruli with astrocyte recording.J Neurosci. 2005 Mar 16;25(11):2917-24. doi: 10.1523/JNEUROSCI.5042-04.2005. J Neurosci. 2005. PMID: 15772351 Free PMC article.
Cited by
-
Effect of Interglomerular Inhibitory Networks on Olfactory Bulb Odor Representations.J Neurosci. 2020 Jul 29;40(31):5954-5969. doi: 10.1523/JNEUROSCI.0233-20.2020. Epub 2020 Jun 19. J Neurosci. 2020. PMID: 32561671 Free PMC article.
-
An Interglomerular Circuit Gates Glomerular Output and Implements Gain Control in the Mouse Olfactory Bulb.Neuron. 2015 Jul 1;87(1):193-207. doi: 10.1016/j.neuron.2015.06.019. Neuron. 2015. PMID: 26139373 Free PMC article.
-
Patterns of heterogeneous expression of pannexin 1 and pannexin 2 transcripts in the olfactory epithelium and olfactory bulb.J Mol Histol. 2012 Dec;43(6):651-60. doi: 10.1007/s10735-012-9443-x. Epub 2012 Sep 4. J Mol Histol. 2012. PMID: 22945868
-
Unraveling the Role of Dopaminergic and Calretinin Interneurons in the Olfactory Bulb.Front Neural Circuits. 2021 Oct 8;15:718221. doi: 10.3389/fncir.2021.718221. eCollection 2021. Front Neural Circuits. 2021. PMID: 34690707 Free PMC article. Review.
-
Adult subventricular zone neural stem cells as a potential source of dopaminergic replacement neurons.Front Neurosci. 2014 Feb 10;8:16. doi: 10.3389/fnins.2014.00016. eCollection 2014. Front Neurosci. 2014. PMID: 24574954 Free PMC article. Review.
References
-
- Aungst JL, Heyward PM, Puche AC, Karnup SV, Hayar A, Szabo G, Shipley MT. Centre-surround inhibition among olfactory bulb glomeruli. Nature. 2003;426:623–629. - PubMed
-
- Baker H, Kawano T, Albert V, Joh TH, Reis DJ, Margolis FL. Olfactory bulb dopamine neurons survive deafferentation-induced loss of tyrosine hydroxylase. Neuroscience. 1984;11:605–615. - PubMed
-
- Baker H, Towle AC, Margolis FL. Differential afferent regulation of dopaminergic and GABAergic neurons in the mouse main olfactory bulb. Brain Res. 1988;450:69–80. - PubMed
-
- Berkowicz DA, Trombley PQ. Dopaminergic modulation at the olfactory nerve synapse. Brain Res. 2000;855:90–99. - PubMed
Publication types
MeSH terms
Substances
Grants and funding
LinkOut - more resources
Full Text Sources
Molecular Biology Databases
Miscellaneous