

Automatic inference of multicellular regulatory networks using informative priors
- PMID: 20090166
- PMCID: PMC3024031
- DOI: 10.1504/IJCBDD.2009.028820
Automatic inference of multicellular regulatory networks using informative priors
Abstract
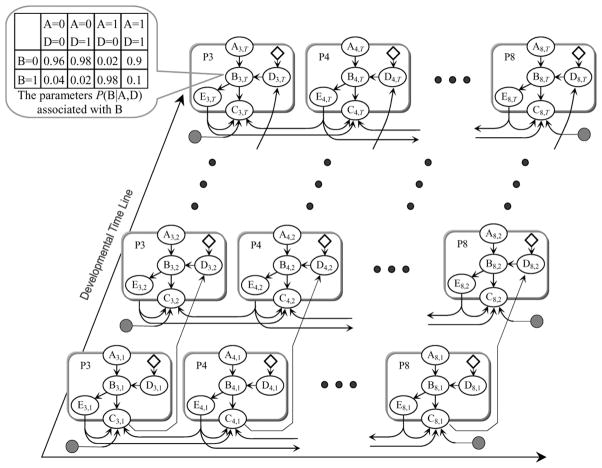
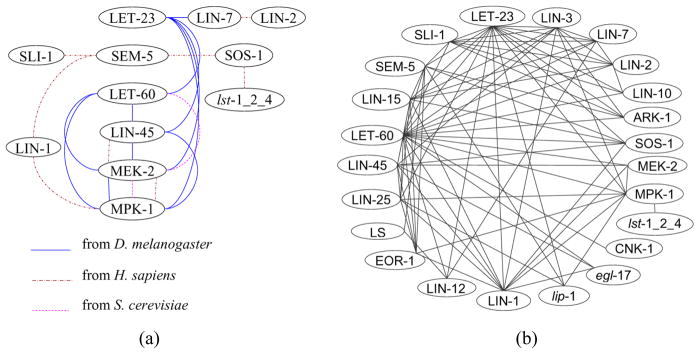
To fully understand the mechanisms governing animal development, computational models and algorithms are needed to enable quantitative studies of the underlying regulatory networks. We developed a mathematical model based on dynamic Bayesian networks to model multicellular regulatory networks that govern cell differentiation processes. A machine-learning method was developed to automatically infer such a model from heterogeneous data. We show that the model inference procedure can be greatly improved by incorporating interaction data across species. The proposed approach was applied to C. elegans vulval induction to reconstruct a model capable of simulating C. elegans vulval induction under 73 different genetic conditions.
Figures


Similar articles
-
Computational modeling of Caenorhabditis elegans vulval induction.Bioinformatics. 2007 Jul 1;23(13):i499-507. doi: 10.1093/bioinformatics/btm214. Bioinformatics. 2007. PMID: 17646336
-
Reconstruction of gene regulatory networks for Caenorhabditis elegans using tree-shaped gene expression data.Brief Bioinform. 2024 Jul 25;25(5):bbae396. doi: 10.1093/bib/bbae396. Brief Bioinform. 2024. PMID: 39133097 Free PMC article.
-
A regulatory network modeled from wild-type gene expression data guides functional predictions in Caenorhabditis elegans development.BMC Syst Biol. 2012 Jun 26;6:77. doi: 10.1186/1752-0509-6-77. BMC Syst Biol. 2012. PMID: 22734688 Free PMC article.
-
A review on the computational approaches for gene regulatory network construction.Comput Biol Med. 2014 May;48:55-65. doi: 10.1016/j.compbiomed.2014.02.011. Epub 2014 Feb 24. Comput Biol Med. 2014. PMID: 24637147 Review.
-
Computational reconstruction of protein-protein interaction networks: algorithms and issues.Methods Mol Biol. 2009;541:89-100. doi: 10.1007/978-1-59745-243-4_5. Methods Mol Biol. 2009. PMID: 19381528 Review.
Cited by
-
From beasts to bytes: Revolutionizing zoological research with artificial intelligence.Zool Res. 2023 Nov 18;44(6):1115-1131. doi: 10.24272/j.issn.2095-8137.2023.263. Zool Res. 2023. PMID: 37933101 Free PMC article. Review.
References
-
- Aderem A. Systems biology: its practice and challenges. Cell. 2005;121(4):511–513. - PubMed
-
- Barabasi AL, Oltvai ZN. Network biology: understanding the cell’s functional organization. Nat Rev Genet. 2004;5(2):101–113. - PubMed
-
- Beitel GJ, Clark SG, Horvitz HR. Caenorhabditis elegans ras gene let-60 acts as a switch in the pathway of vulval induction. Nature. 1990;348(6301):503–509. - PubMed
Publication types
MeSH terms
Grants and funding
LinkOut - more resources
Full Text Sources