. 2010 Apr;31(2):247-58.
doi: 10.1097/AUD.0b013e3181c7daf4.

Identifying cochlear implant channels with poor electrode-neuron interface: partial tripolar, single-channel thresholds and psychophysical tuning curves

Affiliations

Identifying cochlear implant channels with poor electrode-neuron interface: partial tripolar, single-channel thresholds and psychophysical tuning curves

Julie Arenberg Bierer et al. Ear Hear. 2010 Apr.

Erratum in

  • Ear Hear. 2011 Sep-Oct;32(5):633

Abstract

Objective: The goal of this study was to evaluate the ability of a threshold measure, made with a restricted electrode configuration, to identify channels exhibiting relatively poor spatial selectivity. With a restricted electrode configuration, channel-to-channel variability in threshold may reflect variations in the interface between the electrodes and auditory neurons (i.e., nerve survival, electrode placement, and tissue impedance). These variations in the electrode-neuron interface should also be reflected in psychophysical tuning curve (PTC) measurements. Specifically, it is hypothesized that high single-channel thresholds obtained with the spatially focused partial tripolar (pTP) electrode configuration are predictive of wide or tip-shifted PTCs.

Design: Data were collected from five cochlear implant listeners implanted with the HiRes90k cochlear implant (Advanced Bionics Corp., Sylmar, CA). Single-channel thresholds and most comfortable listening levels were obtained for stimuli that varied in presumed electrical field size by using the pTP configuration for which a fraction of current (sigma) from a center-active electrode returns through two neighboring electrodes and the remainder through a distant indifferent electrode. Forward-masked PTCs were obtained for channels with the highest, lowest, and median tripolar (sigma = 1 or 0.9) thresholds. The probe channel and level were fixed and presented with either the monopolar (sigma = 0) or a more focused pTP (sigma > or = 0.55) configuration. The masker channel and level were varied, whereas the configuration was fixed to sigma = 0.5. A standard, three-interval, two-alternative forced choice procedure was used for thresholds and masked levels.

Results: Single-channel threshold and variability in threshold across channels systematically increased as the compensating current, sigma, increased and the presumed electrical field became more focused. Across subjects, channels with the highest single-channel thresholds, when measured with a narrow, pTP stimulus, had significantly broader PTCs than the lowest threshold channels. In two subjects, the tips of the tuning curves were shifted away from the probe channel. Tuning curves were also wider for the monopolar probes than with pTP probes for both the highest and lowest threshold channels.

Conclusions: These results suggest that single-channel thresholds measured with a restricted stimulus can be used to identify cochlear implant channels with poor spatial selectivity. Channels having wide or tip-shifted tuning characteristics would likely not deliver the appropriate spectral information to the intended auditory neurons, leading to suboptimal perception. As a clinical tool, quick identification of impaired channels could lead to patient-specific mapping strategies and result in improved speech and music perception.


Figures

Figure 1
Figure 1
Schematic of electrode configurations. The current path from active to return electrode(s) is represented by the arrows. The magnitude of current at the active electrode, -i, indicates that biphasic pulses were delivered cathodically first. For monopolar (top), the return current is delivered to an extracochlear return electrode located in the temporal bone, for TP (middle) the return current is equally divided and delivered to the two flanking intracochlear electrodes. For pTP (bottom), a fraction (σ) of the return current is directed to the extracochlear return electrode.
Figure 2
Figure 2
Schematic of forward masking paradigm showing masker/probe amplitude (dB re. 1 mA) as a function of time (ms). The masker was a 204 ms pulse train that varied in stimulus level but was fixed with a pTP fraction of σ = 0.5. The masker pulse train preceded the 10.2 ms probe pulse train by 9.18 ms. The probe configuration was either σ = 0 or the largest sigma possible for each subject. The probe was fixed in level to 3 dB above threshold, unless otherwise specified. The masker varied in level to reach masked threshold, the amount of masking necessary to just mask the probe. The inset shows the biphasic pulses that made up both the masker and probe pulse trains. Pulses were 102 μs/phase presented at a rate of 918 pulses per second (interpulse interval of 0.8 ms). The inset shows two biphasic pulses from the pulse train.
Figure 3
Figure 3
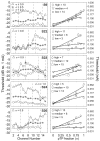
Single-channel thresholds across subjects and configurations. In the left column, each panel plots the single-channel detection thresholds for a given subject (indicated in the top left corner). The abscissa represents cochlear implant channel from apical to basal and the ordinate represents detection threshold in decibels relative to 1 mA. Electrode configuration is indicated by symbols and for the triangles is different for each subject. The vertical dashed lines indicate the lowest, median and highest threshold channels obtained with the largest pTP fraction for each subject. In the right column, each panel plots the single-channel detection thresholds for a given subject as a function of partial tripolar fraction (σ) on the abscissa. Symbols indicate the stimulus channel based on the threshold for the largest pTP fraction possible (corresponding to the vertical dashed lines in the left panels). The dashed lines are the least-squared error calculations for each channel.
Figure 4
Figure 4
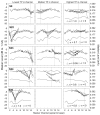
Forward-masked psychophysical tuning curves (PTCs) for all subjects plotted using the raw masker levels, which were measured as the maker level that just masked detection of the probe (ordinate in decibels (left) and mA (right)). Subject is indicated in the top of the left panels. The left, middle, and right panels are PTCs for the lowest, median and highest threshold channels, respectively (as indicated in Fig. 3). The shaded grey lines represent masker-alone threshold and most comfortable level. Symbols indicate the probe configuration and vertical dashed lines indicate the probe channel. The bold lines indicate the slope of the best fit line from the estimated tip of the PTC to the point where the data crosses 80% of the masker-alone dynamic range. The lines were extended for ease of viewing.
Figure 5
Figure 5
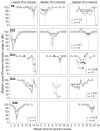
Forward-masked psychophysical tuning curves (PTCs) for all subjects plotted using the masker levels relative to the percentage of masker-alone dynamic range in dB (masker-alone MCL – masker-alone threshold) (ordinate). Conventions are as in Fig. 4. Each row plots PTCs for a given subject, indicated in the top of the left panels. The left and right panels represent low- and high-threshold probe channels, respectively. The width was measured at half-maximum indicated by the horizontal line.
Figure 6
Figure 6
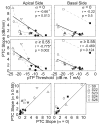
Summary of PTC slope calculations. Symbols represent subject number and fill represents threshold (open = lowest, gray = median, and black = highest). Data from a given subject are connected by a dashed line. The negative apical slopes are inverted. Top row plots the slope of the σ = 0 PTCs in dB/mm (ordinate) as a function of pTP threshold for the apical (left) and basal (right) sides of the curves. The least-square error best fit line is shown in bold. Middle row plots the slope of the σ >= 0.55 PTCs. Conventions are as in the top row. Lower row plots PTC slopes for σ = 0 (abscissa) versus σ >= 0.55 probe (ordinate) for the apical (left) and basal (right) sides of the curves.
Figure 7
Figure 7
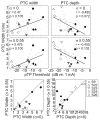
Summary of PTC width and depth calculations. Symbols represent subject number and fill represents threshold (open = lowest, gray = median, and black = highest). Data from a given subject are connected by a dashed line. The left column plots PTC width in mm and the right is PTC depth in dB. Top row plots widths and depths of the σ = 0 PTCs as a function of pTP threshold. The least-square error best fit line is shown in bold. Middle row plots the widths and depths of the σ >= 0.55 PTCs. Conventions are as in the top row. Lower row plots PTC widths and depths for σ = 0 (abscissa) versus σ >= 0.55 probe (ordinate).
Figure 8
Figure 8
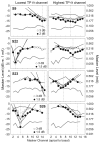
Lower probe level PTCs using raw masker level in dB re. 1 mA. Conventions are as in Fig. 4. Each row plots PTCs for a given subject, indicated in the top of the left panels. The left and right panels plot low- and high-threshold probe channels, respectively. The fill of the symbol represents the probe level, either filled (1.5 or 2 dB above threshold) or open (3 dB above threshold).
Figure 9
Figure 9
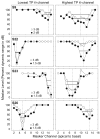
Lower probe level PTCs using percentage of masker-alone dynamic range in dB. Conventions are as in Fig. 5. Each row plots PTCs for a given subject, indicated in the top of the left panels. The left and right panels represent low- and high-threshold probe channels, respectively. The fill of the symbol represents the probe level, either filled (1.5 or 2 dB above threshold) or open (3 dB above threshold).
Figure 10
Figure 10
Summary of lower probe level PTC slopes, widths and depths calculations. Data from a given subject are connected by a dashed line. Top row plots the apical (left) and basal (right) PTC slopes in dB/mm as a function of pTP threshold (abscissa). Note that the negative apical slopes are inverted. The lower row plots the PTC width (left) and the PTC depth (right) as a function of pTP threshold (abscissa). The bold lines indicate the least-square error best fit to the data.

References

    1. Berenstein CK, Mens LH, Mulder JJ, et al. Current steering and current focusing in cochlear implants: Comparison of monopolar, tripolar, and virtual channel electrode configurations. Ear Hear. 2008;29(2):250–260. - PubMed
    1. Bierer JA. Threshold and channel interaction in cochlear implant users: Evaluation of the tripolar electrode configuration. J Acoust Soc Am. 2007;121(3):1642–1653. - PubMed
    1. Bierer JA, Middlebrooks JC. Auditory cortical images of cochlear-implant stimuli: Dependence on electrode configuration. J Neurophysiol. 2002;87(1):478–492. - PubMed
    1. Boex C, Kos MI, Pelizonne M. Forward masking in different cochlear implant systems. J Acoust Soc Am. 2003;114(4 Pt 1):2058–2065. - PubMed
    1. Bonham BH, Litvak LM. Current focusing and steering: Modeling, physiology, and psychophysics. Hear Res. 2008;242(12):141–53. - PMC - PubMed

Publication types