. 2010 Feb 4;463(7281):657-61.
doi: 10.1038/nature08704. Epub 2010 Jan 20.

Evidence for grid cells in a human memory network

Affiliations

Evidence for grid cells in a human memory network

Christian F Doeller et al. Nature. .

Abstract

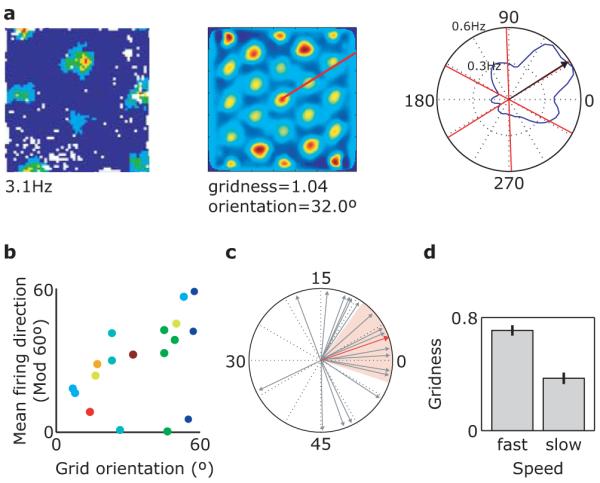
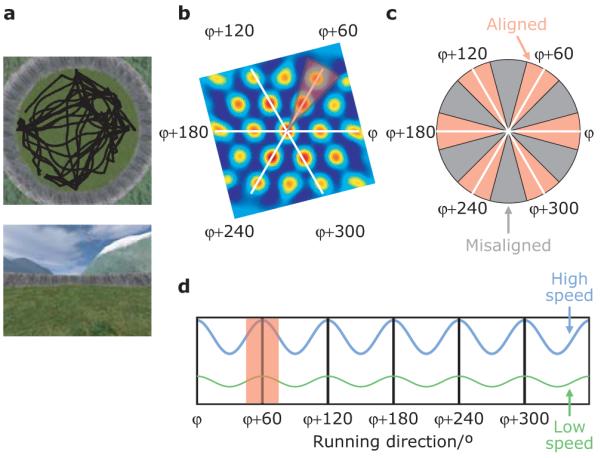
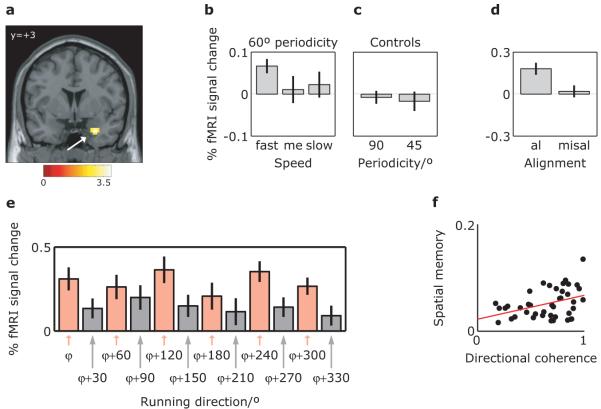
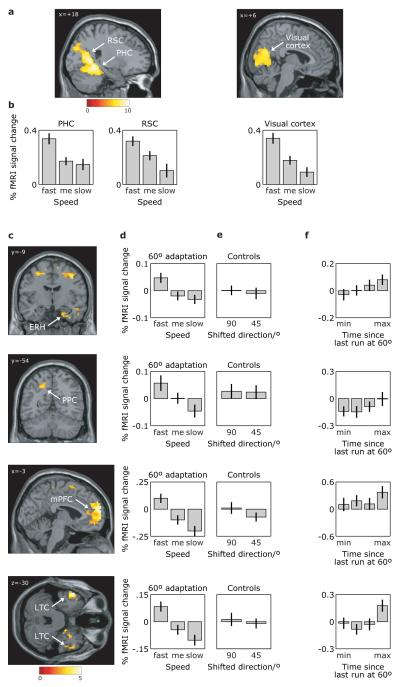
Grid cells in the entorhinal cortex of freely moving rats provide a strikingly periodic representation of self-location which is indicative of very specific computational mechanisms. However, the existence of grid cells in humans and their distribution throughout the brain are unknown. Here we show that the preferred firing directions of directionally modulated grid cells in rat entorhinal cortex are aligned with the grids, and that the spatial organization of grid-cell firing is more strongly apparent at faster than slower running speeds. Because the grids are also aligned with each other, we predicted a macroscopic signal visible to functional magnetic resonance imaging (fMRI) in humans. We then looked for this signal as participants explored a virtual reality environment, mimicking the rats' foraging task: fMRI activation and adaptation showing a speed-modulated six-fold rotational symmetry in running direction. The signal was found in a network of entorhinal/subicular, posterior and medial parietal, lateral temporal and medial prefrontal areas. The effect was strongest in right entorhinal cortex, and the coherence of the directional signal across entorhinal cortex correlated with spatial memory performance. Our study illustrates the potential power of combining single-unit electrophysiology with fMRI in systems neuroscience. Our results provide evidence for grid-cell-like representations in humans, and implicate a specific type of neural representation in a network of regions which supports spatial cognition and also autobiographical memory.


Figures

Figure 1
Figure 1. The mean firing directions of directional grid cells are aligned with the grid
a, Left – Firing rate map of a typical ‘conjunctive’ directional grid cell showing firing rate as a function of the rat’s location within a 1m2 box (red: high firing rate, blue: low rate; white: unvisited location). Centre – Spatial autocorrelogram constructed from the ratemap. Right – Polar firing rate map for the same cell. Black arrow indicates mean firing direction. Red lines indicate the main axes of the grid firing pattern identified from the spatial autocorrelogram (see centre). b, Scatter plot of all directional grid cells (n=18) showing grid orientation vs. circular mean firing direction, modulo 60°. Cells from different rats (n=8) are coloured differently. c, Angular difference between the circular mean firing direction of each cell and the nearest axis of its grid-like firing pattern is not distributed uniformly (Rayleigh test of uniformity; P=0.007) and is significantly clustered around zero (Monte Carlo simulation; P<0.001). Red arrow shows the mean difference (3.15°), red shaded area indicates the 95% confidence interval. d, The spatial organization of grid cell firing is less strongly apparent during slow movement and immobility than during fast movement. Bar graph showing mean gridness (a measure of 6-fold spatial periodicity, see Methods) score for 113 grid cells, separately for fast and slow movements (median split), paired t-test; P=2.2×10⁻¹¹.
Figure 2
Figure 2. fMRI: virtual reality arena and experimental logic
a, Human participants (n=42) explored a circular virtual reality environment, bounded by a cliff and surrounded by orientation cues (mountains), finding objects and having to replace them in the correct locations. Above: aerial view, including one participant’s virtual trajectory (black line). Below: participant’s view. b, Spatial autocorrelogram of a typical grid cell showing the three main axes of the grid (white lines) and a 30° sector aligned with the grid (red). c, Schematic of running directions aligned (red) and misaligned (grey) with the grid. d, Given the alignment of directionally modulated grid cells with the grid and the constant grid orientation across cells (Fig. 1b), we predicted a sinusoidal modulation of fMRI signal by running direction with 6-fold rotational symmetry, and a stronger effect for faster (blue) than slower (green) runs (see Fig. 1d). Note that the absolute orientation of the pattern (‘mean grid orientation’, φ) will not be known a priori.
Figure 3
Figure 3. Modulation of entorhinal cortical activity by running direction with 6-fold rotational symmetry, and correlation with spatial memory
a, Sinusoidal modulation of activity by running direction with 6-fold rotational symmetry. The orientation of potential grids in each participant’s entorhinal cortex was estimated on one half of the data, and the correspondingly aligned sinusoidal regressor was fitted to the other half of the data, showing a significant modulation only in right entorhinal cortex. Plot shows fMRI activation for fast runs on an aligned structural template; colorbar indicates t-statistic; all reported effects of whole-brain analyses are significant at P<0.001 uncorrected; the t-image is thresholded at P<0.01 for display purposes; peak MNI coordinates: 30/3/−30; peak z-score=3.59. b, Directional modulation depends on running speed, being present for fast, but not for medium or slow runs. c, Directional modulation during fast runs has 60° directional periodicity, not 90° or 45° (i.e. to 6-fold rather than 4- or 8-fold rotational symmetry). Bar plots in (b) and (c) show the mean amplitude of sinusoidal modulation for the peak voxel in (a). d, Activation for aligned (within 15° of the main axes of the grid, see Fig. 2c) and misaligned fast runs relative to baseline (epochs of no movement in the environment) in the peak voxel shown in (a), confirming the sinusoidal modulation effect. e, To examine the pattern underlying these effects, we plotted the average fMRI signal over the entire timeseries of all voxels in the entorhinal ROI for all directions of aligned (red) and misaligned (grey) fast runs, relative to baseline, see Fig. 2c. f, The coherence of the potential grid orientations in each participant’s right entorhinal cortex (mean length of resultant direction vector) correlated significantly with that participant’s spatial memory (1/mean distance of object replacement locations from correct locations; range = 7.4 to 61.7 virtual meters; mean=25.4, Spearman’s rho=0.32, P=0.039. Each dot represents one participant. me, medium speed; al, aligned runs; misal, misaligned runs; vm, virtual metres. Bars here and in other figures show mean and s.e.m. over participants.
Figure 4
Figure 4. fMRI adaptation to running direction and to runs at 60° from it
a, Activity in parahippocampal (PHC; 24/−48/−12; z=7.13), retrosplenial (RSC; 18/−57/18; z=7.16), and visual (peak at 18/−69/15; z=7.11) cortices shows adaptation to absolute running direction. Plot shows the t-statistic for the parameter estimate of the adaptation regressor (log(time since last run in current direction)). b, Adaptation is greater for faster runs, showing the adaptation effect for the peak voxels in the three regions for fast, medium, and slow runs. c, fMRI adaptation to runs at 60° from the current direction (regressor: log(time since last run at 60° from the current direction)) is seen in a network of regions, including: entorhinal cortex extending into subiculum (ERH; 21/−9/−30; z=3.28), anterior entorhinal/perirhinal (33/0/−27; z=3.69); posterior parietal (PPC; −18/−54/45; z=3.24); medial prefrontal (mPFC; −3/63/15; z=4.96), lateral temporal cortices (LTC; left: −54/9/−30; z=4.99; right: 42/15/−36; z=3.48) and precentral gyrus/superior frontal gyrus/motor cortex. These effects are independent of any basic (360°) directional adaptation (images are exclusively masked by the effects of basic directional adaptation at threshold P<0.05, uncorrected). d, The 60° adaptation effect is specific to fast runs. e, No significant adaptation is seen for fast running at 45° or 90° from the current direction. f, fMRI activity as a function of time since last fast run at 60° from the current direction (log(time) binned in quartiles), illustrating the adaptation effect. Signal in (d)-(f) shown for the peak voxel in (c). All effects significant at P<0.001, uncorrected; For display purposes, t-images are thresholded at P<0.000001 in (a) and P<0.01 in (c).

Similar articles

Cited by

References

    1. Hafting T, Fyhn M, Molden S, Moser MB, Moser EI. Microstructure of a spatial map in the entorhinal cortex. Nature. 2005;436:801–806. - PubMed
    1. McNaughton BL, Battaglia FP, Jensen O, Moser EI, Moser MB. Path integration and the neural basis of the ‘cognitive map’. Nat. Rev. Neurosci. 2006;7:663–678. - PubMed
    1. Burgess N, Barry C, O’Keefe J. An oscillatory interference model of grid cell firing. Hippocampus. 2007;17:801–812. - PMC - PubMed
    1. Hasselmo ME. A model of episodic memory: mental time travel along encoded trajectories using grid cells. Neurobiol. Learn. Mem. 2009;92:559–573. - PMC - PubMed
    1. Barry C, Hayman R, Burgess N, Jeffery KJ. Experience-dependent rescaling of entorhinal grids. Nat. Neurosci. 2007;10:682–684. - PubMed

Publication types