. 2010 Jan 15;6(1):e1000810.
doi: 10.1371/journal.pgen.1000810.

Co-orientation of replication and transcription preserves genome integrity

Affiliations

Co-orientation of replication and transcription preserves genome integrity

Anjana Srivatsan et al. PLoS Genet. .

Abstract

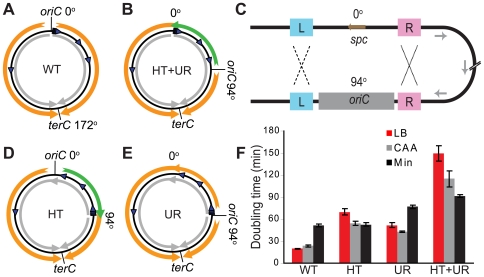
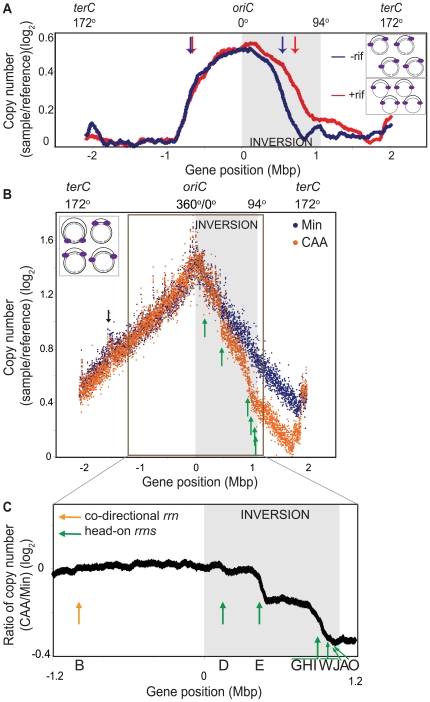
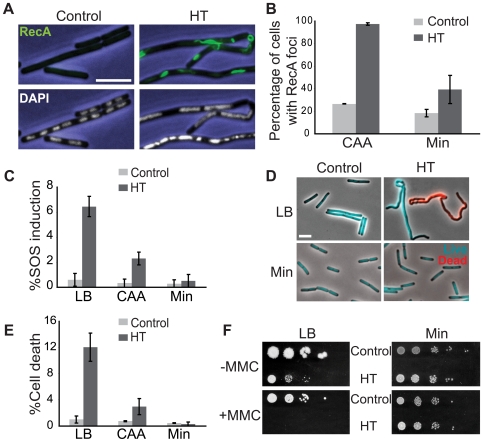
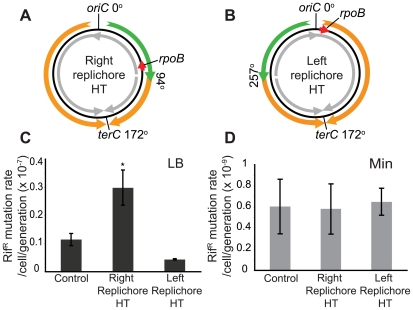
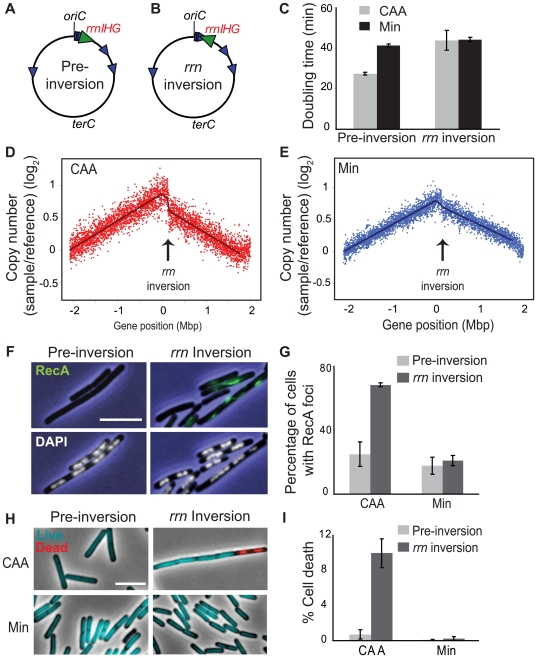
In many bacteria, there is a genome-wide bias towards co-orientation of replication and transcription, with essential and/or highly-expressed genes further enriched co-directionally. We previously found that reversing this bias in the bacterium Bacillus subtilis slows replication elongation, and we proposed that this effect contributes to the evolutionary pressure selecting the transcription-replication co-orientation bias. This selection might have been based purely on selection for speedy replication; alternatively, the slowed replication might actually represent an average of individual replication-disruption events, each of which is counter-selected independently because genome integrity is selected. To differentiate these possibilities and define the precise forces driving this aspect of genome organization, we generated new strains with inversions either over approximately 1/4 of the chromosome or at ribosomal RNA (rRNA) operons. Applying mathematical analysis to genomic microarray snapshots, we found that replication rates vary dramatically within the inverted genome. Replication is moderately impeded throughout the inverted region, which results in a small but significant competitive disadvantage in minimal medium. Importantly, replication is strongly obstructed at inverted rRNA loci in rich medium. This obstruction results in disruption of DNA replication, activation of DNA damage responses, loss of genome integrity, and cell death. Our results strongly suggest that preservation of genome integrity drives the evolution of co-orientation of replication and transcription, a conserved feature of genome organization.


Conflict of interest statement

The authors have declared that no competing interests exist.

Figures

Figure 1
Figure 1. Alteration of different aspects of genome organization results in different growth defects.
(A) Schematic diagram of the wild type B. subtilis chromosome (black circle). oriC at 0° and terC at 172° represent the origin and terminus of DNA replication, respectively. Orange arrows: replication; grey arrows: predominant direction of transcription; blue arrowheads: rRNA operons. (B) Schematic diagram of a mutant chromosome with oriC relocated to 94° , resulting in head-on transcription and unequal replichores (HT+UR). Green arrow: replication head-on to transcription between 0° and 94°. (C) Schematic diagrams of homologous recombination events leading to inversions of ¼ of the chromosome. L and R: sequences flanking oriC that are repeated at 0° and 94°; spc: spectinomycin resistance gene, which was inserted to replace the endogenous oriC at 0° . Recombination at L (dashed lines) and R (dotted lines) give rise to the chromosomes shown schematically in (D,E), respectively. (D) Schematic diagram of the chromosome with an inversion between 0° and 94° resulting in head-on transcription (HT). (E) Schematic diagram of the chromosome with an inversion between 0° and 94° resulting in unequal replichores (UR). (F) Doubling times at 37°C in liquid LB (red bars), minimal medium with (CAA, grey bars) or without (Min, black bars) casamino acids, calculated by measuring OD600. Data shown are for strains in the JH642 background.
Figure 2
Figure 2. Genomic microarray profiles of the HT inversion strain.
(A) Synchronized replication profile of the HT strain. Cells containing the dnaB134ts allele were grown in Min at 30°C and their replication cycle was synchronized by shifting to 45°C for 60 minutes, and then back to 30°C to allow replication initiation. Genomic profiles were obtained 30 minutes after initiation, relative to pre-initiation reference DNA. Profiles were obtained without (blue) or with (red) addition of rifampicin (rif) 4 minutes after initiation to inhibit transcription. Elevation of the baseline of the gene dosage profile on the right replichore is likely due to incomplete replication of the pre-initiation reference DNA of the HT strain, despite the 60 minutes incubation at 45°C. Grey shaded region: inversion; blue and red arrows: average positions of replication forks in the absence (blue) or presence (red) of rif. Insets: schematic diagram of chromosomes of the HT strain undergoing synchronized replication with (top), and without (bottom) transcription (grey arrows). Purple ovals: replisomes. (B) Overlay of the asynchronous genomic profiles of the HT strain grown in Min (blue), and CAA (orange). Profiles were obtained from asynchronous cultures grown at 37°C to OD600∼0.5. Average gene dosage ratios (log2) are plotted relative to gene positions adjusted according to deletion of the phage SPβ and the integrative and conjugative element ICEBs1 clusters. The prophage-like skin element is not removed in this strain, which likely explains the small peak at −1.5 Mbp (black arrow). Green arrows: sharp changes in slope at rRNA loci in the CAA profile. Inset: schematic diagram of chromosomes of the HT strain undergoing asynchronous replication. (C) Expanded view of the ratio of gene dosage (log2) in CAA versus Min within the region outlined in B (−1.2 Mbp to 1.2 Mbp). Green arrows: positions of inverted rRNA operons; orange arrow: position of co-directional rrnB; grey shaded region: inversion.
Figure 3
Figure 3. The HT strain exhibits disruption of DNA replication and loss of genome integrity.
(A) RecA localization and nucleoid morphology in the HT and isogenic control strains in CAA. Upper and lower panels: phase contrast images (blue) overlaid with RecA-GFP (green) or DAPI (white) fluorescence images, respectively. (B) Percentages of cells with RecA-GFP foci in the indicated media. Cells were grown in CAA or Min and stained with DAPI and the membrane dye FM4-64 (not shown) to count individual cells. Light grey bars: control; dark grey bars: HT strain. The HT strain with recA-gfp was extremely sick in LB. (C) Induction of the SOS DNA damage response in the HT and isogenic control strains in the indicated media, as monitored using a TagC-GFP reporter. The total length of SOS-positive cells was divided by the total length of cells in each field. Light grey bars: control; dark grey bars: HT strain. (D) Live/dead staining of the HT and control strains in LB and Min. The fluorescent dyes SYTO9 (cyan) and propidium iodide (red) were added to exponential phase cultures (OD600∼0.2–0.6) to label live and dead cells, respectively. (E) Average percentages of dead cells in the control (light grey bars) and HT (dark grey bars) strains in different growth media (LB, CAA and Min). The cell length that was stained with propidium iodide was divided by the total length of cells in each field. (F) Mitomycin C (MMC) sensitivity of the HT and isogenic control strains in LB and Min. Cells were grown to OD600 = 0.3 and serial dilutions ranging from 10−2 to 10−6 were spotted on LB and Min plates with or without MMC (0.0625 µg/ml). Plates were scanned after overnight incubation at 37°C. Scale bar in A and D: 5 µm.
Figure 4
Figure 4. Increased mutation rate of a gene within the inversion in the HT strain.
(A,B) Schematic diagrams of chromosomes (black circles) with inversion of ½ of either the right (A) or the left (B) replichore, resulting in head-on transcription (HT) within the inversion. Orange and green arrows: replication co-directional and head-on to transcription, respectively; grey arrows: predominant direction of transcription. Mutations conferring resistance to rifampicin (rifR) map to the rpoB gene (red arrow) which is transcribed co-directional to replication in the wild type and left replichore HT strains, but transcribed head-on in the right replichore HT strain. (C) Spontaneous rifR mutation rates as measured by fluctuation tests in LB (dark grey bars) in the control, right and left replichore HT strains. *: rifR rate in the right replichore inversion strain is significantly different from control (P<0.05). (D) RifR mutation rates in Min (light grey bars).
Figure 5
Figure 5. Inversion of rrnIHG impedes replication, triggers RecA recruitment, and elevates cell death.
(A,B) Schematic diagrams of the chromosomes (black circles) of the pre-inversion control strain (A) and the rrnIHG (rrn) inversion strain (B). Blue arrowheads: rRNA operons; large green arrowhead: rrnIHG cluster. (C) Doubling times of the pre-inversion and rrn inversion strains at 37°C in CAA (grey bars) and Min (black bars). (D,E) Asynchronous gene dosage profiles of the rrn inversion strain in CAA (D) and Min (E). Profiles were obtained from asynchronous cultures grown at 37°C in the indicated media to OD600∼0.5. Average ratios of copy number (log2) in the rrn inversion strain relative to fully-replicated control are plotted against the genomic position. Arrows indicate the position of the rrnIHG inversion. (F) RecA recruitment and nucleoid morphology in the pre-inversion and rrn inversion strains in CAA, obtained as described in Figure 3A. Blue: phase contrast images; green: RecA foci; white: nucleoids stained with DAPI. (G) Average percentage of cells with RecA recruitment in the indicated media. Light grey bars: pre-inversion control; dark grey bars: rrn inversion. (H) Live/dead staining of the pre-inversion and rrn inversion strains grown in CAA and Min. Images were obtained as described in Figure 3D. Cyan: live cells; red: dead cells. (I) Average percentages of dead cells in the pre-inversion (light grey bars) and rrn inversion (dark grey bars) strains. The cell length that was stained with propidium iodide was divided by the total length of cells in each field. Scale bar in F and H: 5 µm.

Similar articles

Cited by

References

    1. Miura A, Krueger JH, Itoh S, de Boer HA, Nomura M. Growth-rate-dependent regulation of ribosome synthesis in E. coli: expression of the lacZ and galK genes fused to ribosomal promoters. Cell. 1981;25:773–782. - PubMed
    1. Gourse RL, Gaal T, Bartlett MS, Appleman JA, Ross W. rRNA transcription and growth rate-dependent regulation of ribosome synthesis in Escherichia coli. Annu Rev Microbiol. 1996;50:645–677. - PubMed
    1. Bremer H, Dennis P. Modulation of Chemical Composition and Other Parameters of the Cell by Growth Rate. In: Neidhardt FC, Curtiss RI, Ingraham JL, Lin ECC, Low KB, editors. Escherichia coli and Salmonella: Cellular and Molecular Biology. Washington, DC: ASM Press; 1996. pp. 1553–1569.
    1. Cooper S, Helmstetter CE. Chromosome replication and the division cycle of Escherichia coli B/r. J Mol Biol. 1968;31:519–540. - PubMed
    1. French S. Consequences of replication fork movement through transcription units in vivo. Science. 1992;258:1362–1365. - PubMed

Publication types