. 2010 Jan 18;5(1):e8753.
doi: 10.1371/journal.pone.0008753.

17-AAG induces cytoplasmic alpha-synuclein aggregate clearance by induction of autophagy

Affiliations

17-AAG induces cytoplasmic alpha-synuclein aggregate clearance by induction of autophagy

Michael Riedel et al. PLoS One. .

Abstract

Background: The accumulation and aggregation of alpha-synuclein in nerve cells and glia are characteristic features of a number of neurodegenerative diseases termed synucleinopathies. alpha-Synuclein is a highly soluble protein which in a nucleation dependent process is capable of self-aggregation. The causes underlying aggregate formation are not yet understood, impairment of the proteolytic degradation systems might be involved.

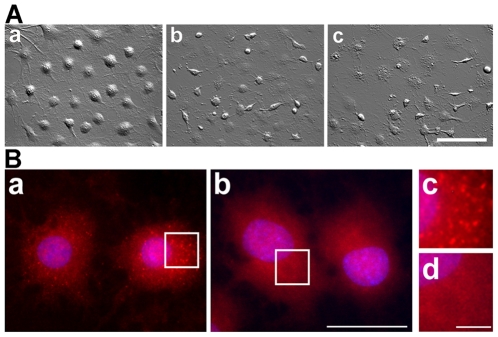
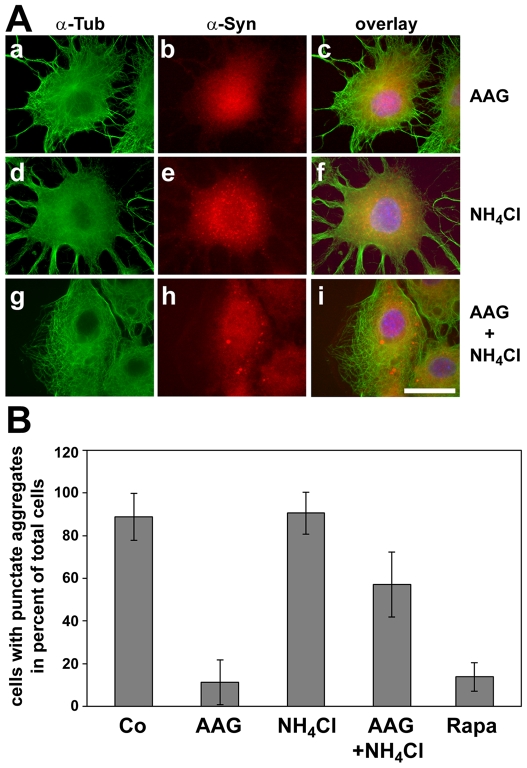
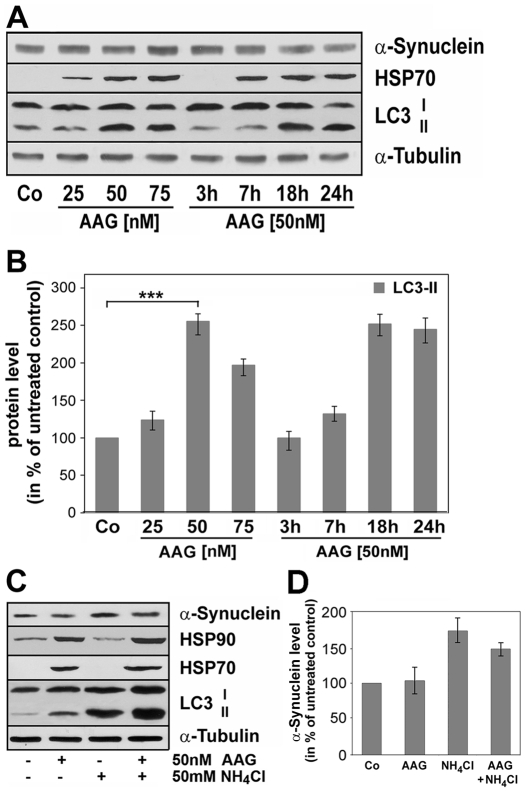
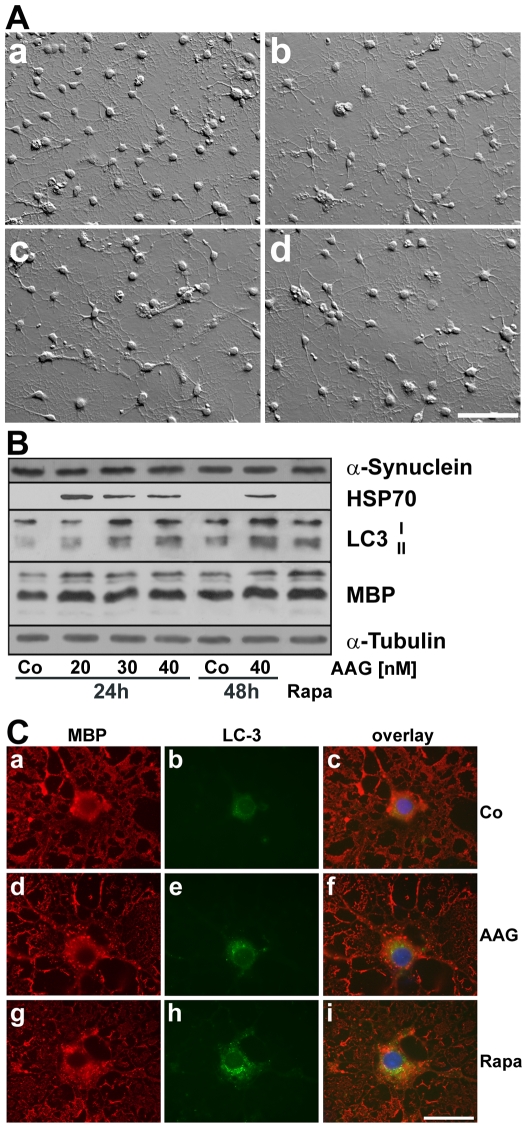
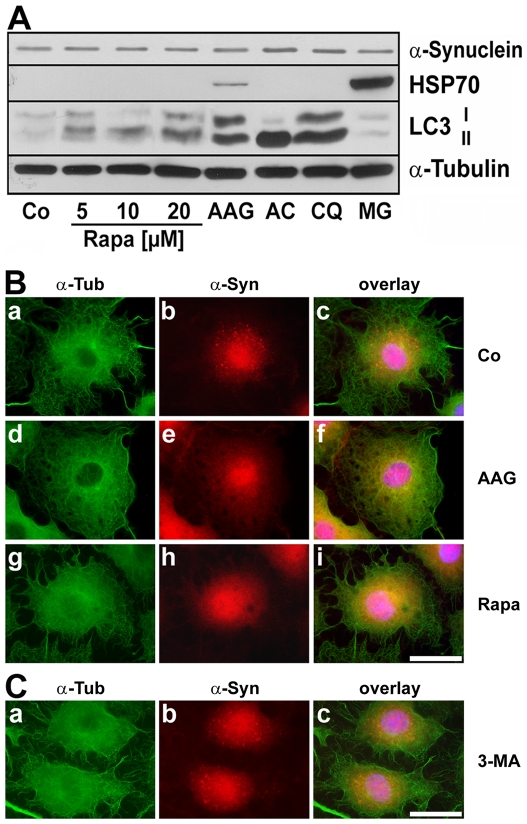
Methodology/principal findings: In the present study the possible aggregate clearing effects of the geldanamycin analogue 17-AAG (17-(Allylamino)-17-demethoxygeldanamycin) was investigated. Towards this, an oligodendroglial cell line (OLN-93 cells), stably expressing human alpha-synuclein (A53T mutation) was used. In these cells small punctate aggregates, not staining with thioflavine S, representing prefibrillary aggregates, occur characteristically. Our data demonstrate that 17-AAG attenuated the formation of alpha-synuclein aggregates by stimulating macroautophagy. By blocking the lysosomal compartment with NH(4)Cl the aggregate clearing effects of 17-AAG were abolished and alpha-synuclein deposits were enlarged. Analysis of LC3-II immunoreactivity, which is an indicator of autophagosome formation, further revealed that 17-AAG led to the recruitment of LC3-II and to the formation of LC3 positive puncta. This effect was also observed in cultured oligodendrocytes derived from the brains of newborn rats. Inhibition of macroautophagy by 3-methyladenine prevented 17-AAG induced occurrence of LC3 positive puncta as well as the removal of alpha-synuclein aggregates in OLN-A53T cells.

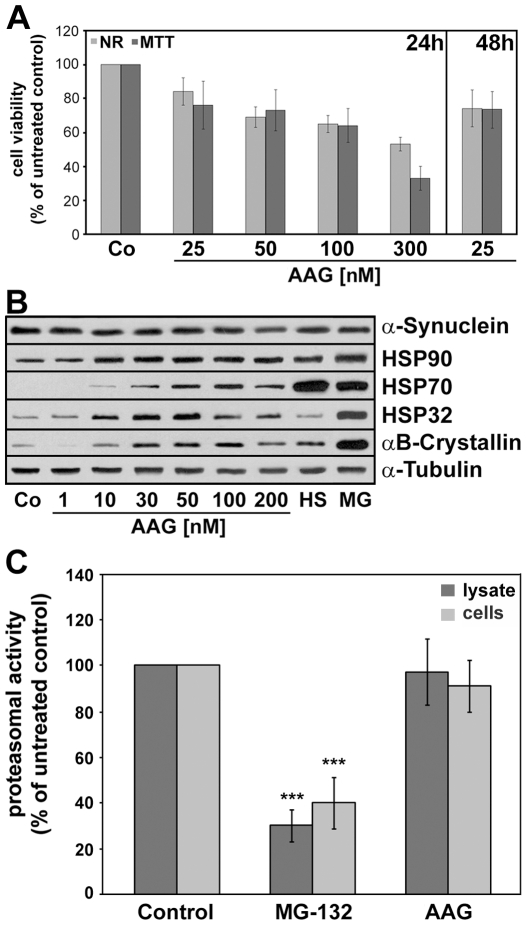
Conclusions: Our data demonstrate for the first time that 17-AAG not only causes the upregulation of heat shock proteins, but also is an effective inducer of the autophagic pathway by which alpha-synuclein can be removed. Hence geldanamycin derivatives may provide a means to modulate autophagy in neural cells, thereby ameliorating pathogenic aggregate formation and protecting the cells during disease and aging.


Conflict of interest statement

Competing Interests: The authors have declared that no competing interests exist.

Figures

Figure 1
Figure 1. Small punctated α-synuclein aggregates are removed by 17-AAG.
(A) Hoffman modulation contrast images of OLN-A53T cells are shown. Scale bar, 75 µm. Cells were either untreated (a) or treated with 50 nM 17-AAG for 24 h (b) or 48 h (c). (B) Cells were subjected to indirect immunofluorescence using antibodies against α-syn (SNL-4, red). Nuclei were stained with DAPI. Cells were either untreated (a) or treated with 50 nM 17-AAG for 24 h (b). In c and d, enlargements of the respective regions indicated in a and b are shown. Scale bars, 20 µm (a, b), 2.5 µm (c, d).
Figure 2
Figure 2. 17-AAG induces a heat shock response in OLN-A53T cells and does not impair proteasomal activity.
(A) Determination of cytotoxic potential. Cells were exposed to different concentrations of 17-AAG as indicated. After 24 h, neutral red and MTT assays were carried out. Values represent the mean ± SEM of 16 microwells each of two independent experiments (n = 32). (B) Immunoblot analysis of heat shock protein induction. Cells were treated with 17-AAG (1–200 nM, 24 h), or subjected to heat shock (HS: 44°C, 30 min, 24 h recovery) or to MG-132 (MG: 1 µM, 24 h). Cell lysates were prepared and immunoblot analysis was carried out with antibodies against the individual proteins as indicated on the right. Co, untreated control. (C) Proteasomal activity was determined in cell lysates treated with 17-AAG (lysate) and in cell lysates prepared from 17-AAG treated live cells (cells). Cytoplasmic lysates were incubated with the proteasomal inhibitor MG-132 (1 µM, 60 min) as a positive control, or 17-AAG (50 nM, 60 min). Cells were treated with MG-132 (1 µM, 24 h) and 17-AAG (50 nM, 24 h). The post-glutamyl-peptidase-hydrolase activity was determined using fluorogenic substrate Z-Leu-Leu-Glu-AMC (see Materials and Methods). The cleavage of the substrate is inhibited by MG-132 but not by 17-AAG. Data are expressed as percent of the untreated control and show the mean ± SEM from 3 independent experiments. Statistical evaluation was carried out by ANOVA/Fisher's LSD: ***p≤0.01 for MG-132 versus control.
Figure 3
Figure 3. 17-AAG induced clearance of α-synuclein aggregates is prevented by lysosomal inhibition.
(A) Cells were treated either with 50 nM 17-AAG (AAG; a–c), or with 50 mM NH4Cl (d–f) for 24 h or with a combination of both (g–i). Cells were fixed with paraformaldehyde and indirect immunofluorescence staining was carried out using antibodies against α-tubulin (a, d, g; green) and α-synuclein (b, e, h; red). Overlay with DAPI (c, f, i). Scale bar, 20 µm. Note that in cells treated with NH4Cl aggregates remain or are even enlarged. (B) Quantitative evaluation of the percentage of cells expressing puntacte α-synuclein aggregates. At least 350 cells on four cover slips each of two independent experiments were counted. Data are expressed as per cent of total cells +/− SD. Experimental conditions were as in (A). Additionally, cells treated with rapamycin (Rapa, 5 µM, 24 h) were counted.
Figure 4
Figure 4. 17-AAG leads to induction of macroautophagy in a time and concentration dependent manner in OLN-A53T cells.
(A) Immunoblot analysis of LC3. Cell lysates were prepared from OLN-A53T cells treated for 24 h with different concentrations of 17-AAG (25–75 nM) and from cells treated with 50 nM 17-AAG for different times (3 h–24 h). Immunoblot analysis was carried out with antibodies against the individual proteins as indicated on the right. Co, untreated control. 17-AAG causes the recruitment of LC3-II, an indicator of macroautophagy. A representative blot of three independent experiments is shown. (B) Quantitative evaluation of LC3-II protein level was carried out by densitometric scanning of the blots. Results show the mean ± SEM from three independent experiments. LC3-II levels were normalized to α-tubulin and the total amount of control was set to 100%. Statistical evaluation was carried out by ANOVA/Fisher's LSD: ***0.01 for 50 nM 17AAG (24 h) versus control (Co). (C) Lysosomal inhibition augments LC3-II levels, indicating the disturbance of the autophagic flux. Cells were treated for 24 h with 17-AAG (50 nM), or NH4Cl (50 mM) or with a combination of both, as indicated. Cell lysates were prepared and immunoblot analysis was carried out with antibodies against the individual proteins as indicated on the right. Co, untreated control. (D) Quantitative evaluation of the α-synuclein levels. Experimental conditions as in (C). Data are the means of two independent experiments +/− SD.
Figure 5
Figure 5. 17-AAG leads to the induction of macroautophagy in cultured rat brain oligodendrocytes.
(A) Hoffman modulation contrast images are shown. Oligodendrocytes (5 div) were prepared from the brains of newborn rats and subjected to 50 nM 17-AAG for 24 h (c) or 48 h (d) or to 5 µM rapamycin for 24 h (b). In (a) the untreated control is shown. Scale bar: 50 µm. (B) Immunoblot analysis of LC3. Cell lysates were prepared from oligodendrocytes (5 div) treated for 24 h or 48 h with different concentrations of 17-AAG (20–40 nM) or with rapamycin (Rapa: 5 µM, 24 h). Immunoblot analysis was carried out with antibodies against the individual proteins as indicated on the right. Co, untreated control. (C) Oligodendrocytes (5 div) were either untreated (Co, a–c), or treated for 24 h with 40 nM 17AAG (AAG, d–f), or with 5 µM rapamycin (Rapa, g–i), and then subjected to indirect immunofluorescence staining using antibodies against myelin basic proteins (MBP, a,d,g; red) and LC3 (b,e,h; green). In c,f,i the overlays with DAPI staining are shown. Scale bar, 25 µm.
Figure 6
Figure 6. Autophagy induction by rapamycin causes aggregate clearance similarly to 17-AAG.
(A) Immunoblot analysis of LC3 and HSP70. Cells were treated for 24 h with rapamycin (Rapa, 5–20 µM), 17-AAG (AAG, 50 nM), ammonium chloride (AC, 50 mM), chloroquine (CQ, 25 µM) or MG-132 (MG, 1 µM) and subjected to immunoblot analysis using antibodies against HSP70, LC3 and α-tubulin, as indicated on the right. Co, untreated control. (B) OLN-A53T cells were untreated (Co, a–c), or treated for 24 h with 50 nM 17-AAG (AAG, d–f) or with 20 µM rapamycin (Rapa, g–i) and then subjected to indirect immunofluorescence staining using antibodies against α-tubulin (a,d,g; green) and α-synuclein (SNL-4, b,e,h; red). In (c,f,i) the overlays with DAPI staining are shown. Scale bar, 20 µm. (C) Inhibition of macroautophagy by 3-methyladenine. OLN-A53T cells were treated for 24 h with 50 nM 17AAG in combination with 3-MA (10 mM) and then subjected to indirect immunofluorescence staining using antibodies against α-tubulin (a) and α-synuclein (SNL-4, b). In (c) the overlay with DAPI staining is shown. Note that the clearance of punctated α-synuclein aggregates is inhibited by 3-MA. Scale bar, 20 µm.
Figure 7
Figure 7. 17-AAG and rapamycin promote the accumulation of LC3-II and the formation of LC3 positive puncta which is inhibited by 3-MA.
(A) Immunoblot analysis of LC3 and HSP70. Cells were treated with 17-AAG (AAG, 50 nM), rapamycin (20 µM), or 3-methyladenine (3-MA, 10 mM) or with a combination of 17-AAG and 3-MA for 7 h and 24 h, respectively. Cell lysates were prepared and immunoblot analysis was carried out with antibodies against the individual proteins as indicated on the right. Co, untreated control. (B) OLN-A53T cells were either untreated (Co, a–c), or treated for 24 h with 50 nM 17AAG (AAG, d–f), or with a combination of 50 nM 17AAG and 10 mM 3-methyladenine (3-MA, g–i), or with 20 µM rapamycin (Rapa, j–l), and then subjected to indirect immunofluorescence staining using antibodies against α-synuclein (SNL-4, a,d,g,j; red) and LC3 (b,e,h,k, green). In (c,f,i,l) the overlays with DAPI staining are shown. Scale bar, 25 µm. (C) Confocal images of cells treated with 17-AAG as in (B, d–f) are shown. Arrow heads indicate colocalization of LC3 staining with α-synuclein. Scale bar, 5 µm.

Similar articles

Cited by

References

    1. Dickson DW, Lin W, Liu WK, Yen SH. Multiple system atrophy: a sporadic synucleinopathy. Brain Pathol. 1999;9:721–732. - PMC - PubMed
    1. Burn DJ, Jaros E. Multiple system atrophy: cellular and molecular pathology. Mol Pathol. 2001;54:419–426. - PMC - PubMed
    1. Chin SS, Goldman JE. Glial inclusions in CNS degenerative diseases. J Neuropathol Exp Neurol. 1996;55:499–508. - PubMed
    1. Lantos PL. The definition of multiple system atrophy: a review of recent developments. J Neuropathol Exp Neurol. 1998;57:1099–1111. - PubMed
    1. Richter-Landsberg C, Goldbaum O. Stress proteins in neural cells: functional roles in health and disease. Cell Mol Life Sci. 2003;60:337–349. - PMC - PubMed

Publication types