Microporous cell-laden hydrogels for engineered tissue constructs
- PMID: 20091766
- PMCID: PMC2847036
- DOI: 10.1002/bit.22667
Microporous cell-laden hydrogels for engineered tissue constructs
Abstract
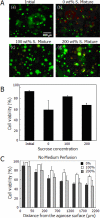
In this article, we describe an approach to generate microporous cell-laden hydrogels for fabricating biomimetic tissue engineered constructs. Micropores at different length scales were fabricated in cell-laden hydrogels by micromolding fluidic channels and leaching sucrose crystals. Microengineered channels were created within cell-laden hydrogel precursors containing agarose solution mixed with sucrose crystals. The rapid cooling of the agarose solution was used to gel the solution and form micropores in place of the sucrose crystals. The sucrose leaching process generated homogeneously distributed micropores within the gels, while enabling the direct immobilization of cells within the gels. We also characterized the physical, mechanical, and biological properties (i.e., microporosity, diffusivity, and cell viability) of cell-laden agarose gels as a function of engineered porosity. The microporosity was controlled from 0% to 40% and the diffusivity of molecules in the porous agarose gels increased as compared to controls. Furthermore, the viability of human hepatic carcinoma cells that were cultured in microporous agarose gels corresponded to the diffusion profile generated away from the microchannels. Based on their enhanced diffusive properties, microporous cell-laden hydrogels containing a microengineered fluidic channel can be a useful tool for generating tissue structures for regenerative medicine and drug discovery applications.
Figures


Similar articles
-
A cell-laden microfluidic hydrogel.Lab Chip. 2007 Jun;7(6):756-62. doi: 10.1039/b615486g. Epub 2007 May 3. Lab Chip. 2007. PMID: 17538718
-
Fabrication of three-dimensional porous cell-laden hydrogel for tissue engineering.Biofabrication. 2010 Sep;2(3):035003. doi: 10.1088/1758-5082/2/3/035003. Epub 2010 Sep 8. Biofabrication. 2010. PMID: 20823504 Free PMC article.
-
Hydrogel bioprinted microchannel networks for vascularization of tissue engineering constructs.Lab Chip. 2014 Jul 7;14(13):2202-11. doi: 10.1039/c4lc00030g. Epub 2014 May 23. Lab Chip. 2014. PMID: 24860845 Free PMC article.
-
Cell-laden hydrogels for osteochondral and cartilage tissue engineering.Acta Biomater. 2017 Jul 15;57:1-25. doi: 10.1016/j.actbio.2017.01.036. Epub 2017 Jan 11. Acta Biomater. 2017. PMID: 28088667 Free PMC article. Review.
-
Microfluidic fabrication of microengineered hydrogels and their application in tissue engineering.Lab Chip. 2012 Jan 7;12(1):45-59. doi: 10.1039/c1lc20859d. Epub 2011 Nov 21. Lab Chip. 2012. PMID: 22105780 Review.
Cited by
-
Advances in Gelatin Bioinks to Optimize Bioprinted Cell Functions.Adv Healthc Mater. 2023 Jul;12(17):e2203148. doi: 10.1002/adhm.202203148. Epub 2023 Feb 27. Adv Healthc Mater. 2023. PMID: 36802199 Free PMC article. Review.
-
Microfluidic techniques for development of 3D vascularized tissue.Biomaterials. 2014 Aug;35(26):7308-25. doi: 10.1016/j.biomaterials.2014.04.091. Epub 2014 Jun 3. Biomaterials. 2014. PMID: 24906345 Free PMC article. Review.
-
Strategies to Maximize the Potential of Marine Biomaterials as a Platform for Cell Therapy.Mar Drugs. 2016 Jan 26;14(2):29. doi: 10.3390/md14020029. Mar Drugs. 2016. PMID: 26821034 Free PMC article. Review.
-
Bioinspired tuning of hydrogel permeability-rigidity dependency for 3D cell culture.Sci Rep. 2015 Mar 10;5:8948. doi: 10.1038/srep08948. Sci Rep. 2015. PMID: 25752700 Free PMC article.
-
Biofabrication under fluorocarbon: a novel freeform fabrication technique to generate high aspect ratio tissue-engineered constructs.Biores Open Access. 2013 Oct;2(5):374-84. doi: 10.1089/biores.2013.0031. Biores Open Access. 2013. PMID: 24083093 Free PMC article.
References
-
- Aymard P, Martin DR, Plucknett K, Foster TJ, Clark AH, Norton IT. Influence of thermal history on the structural and mechanical properties of agarose gels. Biopolymers. 2001;59(3):131–44. - PubMed
-
- Bakshi A, Fisher O, Dagci T, Himes BT, Fischer I, Lowman A. Mechanically engineered hydrogel scaffolds for axonal growth and angiogenesis after transplantation in spinal cord injury. J Neurosurg Spine. 2004;1(3):322–9. - PubMed
-
- Bignon A, Chouteau J, Chevalier J, Fantozzi G, Carret JP, Chavassieux P, Boivin G, Melin M, Hartmann D. Effect of micro- and macroporosity of bone substitutes on their mechanical properties and cellular response. Journal of Materials Science-Materials in Medicine. 2003;14(12):1089–1097. - PubMed
-
- Bryant SJ, Anseth KS. Controlling the spatial distribution of ECM components in degradable PEG hydrogels for tissue engineering cartilage. J Biomed Mater Res A. 2003;64(1):70–9. - PubMed
-
- Burdick JA, Anseth KS. Photoencapsulation of osteoblasts in injectable RGD-modified PEG hydrogels for bone tissue engineering. Biomaterials. 2002;23(22):4315–23. - PubMed
Publication types
MeSH terms
Substances
Grants and funding
LinkOut - more resources
Full Text Sources
Other Literature Sources

