The role of the unaffected hemisphere in motor recovery after stroke
- PMID: 20091792
- PMCID: PMC6870650
- DOI: 10.1002/hbm.20914
The role of the unaffected hemisphere in motor recovery after stroke
Abstract
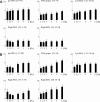
The contribution of the ipsilateral (nonaffected) hemisphere to recovery of motor function after stroke is controversial. Under the assumption that functionally relevant areas within the ipsilateral motor system should be tightly coupled to the demand we used fMRI and acoustically paced movements of the right index finger at six different frequencies to define the role of these regions for recovery after stroke. Eight well-recovered patients with a chronic striatocapsular infarction of the left hemisphere were compared with eight age-matched participants. As expected the hemodynamic response increased linearly with the frequency of the finger movements at the level of the left supplementary motor cortex (SMA) and the left primary sensorimotor cortex (SMC) in both groups. In contrast, a linear increase of the hemodynamic response with higher tapping frequencies in the right premotor cortex (PMC) and the right SMC was only seen in the patient group. These results support the model of an enhanced bihemispheric recruitment of preexisting motor representations in patients after subcortical stroke. Since all patients had excellent motor recovery contralesional SMC activation appears to be efficient and resembles the widespread, bilateral activation observed in healthy participants performing complex movements, instead of reflecting maladaptive plasticity.
(c) 2010 Wiley-Liss, Inc.
Figures


Similar articles
-
A functional MRI study of subjects recovered from hemiparetic stroke.Stroke. 1997 Dec;28(12):2518-27. doi: 10.1161/01.str.28.12.2518. Stroke. 1997. PMID: 9412643
-
Multimodal imaging of brain reorganization in motor areas of the contralesional hemisphere of well recovered patients after capsular stroke.Brain. 2006 Mar;129(Pt 3):791-808. doi: 10.1093/brain/awh713. Epub 2005 Dec 19. Brain. 2006. PMID: 16364955
-
Analysis of fMRI and finger tracking training in subjects with chronic stroke.Brain. 2002 Apr;125(Pt 4):773-88. doi: 10.1093/brain/awf091. Brain. 2002. PMID: 11912111 Clinical Trial.
-
Activation likelihood estimation meta-analysis of motor-related neural activity after stroke.Neuroimage. 2012 Feb 1;59(3):2771-82. doi: 10.1016/j.neuroimage.2011.10.023. Epub 2011 Oct 17. Neuroimage. 2012. PMID: 22023742 Review.
-
Integrated technology for evaluation of brain function and neural plasticity.Phys Med Rehabil Clin N Am. 2004 Feb;15(1):263-306. doi: 10.1016/s1047-9651(03)00124-4. Phys Med Rehabil Clin N Am. 2004. PMID: 15029909 Review.
Cited by
-
A study of dynamic hand orthosis combined with unilateral task-oriented training in subacute stroke: A functional near-infrared spectroscopy case series.Front Neurol. 2022 Aug 11;13:907186. doi: 10.3389/fneur.2022.907186. eCollection 2022. Front Neurol. 2022. PMID: 36034313 Free PMC article.
-
Predicting Motor Outcomes in Stroke Patients Using Diffusion Spectrum MRI Microstructural Measures.Front Neurol. 2019 Feb 18;10:72. doi: 10.3389/fneur.2019.00072. eCollection 2019. Front Neurol. 2019. PMID: 30833925 Free PMC article.
-
Ipsilateral versus bilateral limb-training in promoting the proliferation and differentiation of endogenous neural stem cells following cerebral infarction in rats.Neural Regen Res. 2012 Dec 5;7(34):2698-704. doi: 10.3969/j.issn.1673-5374.2012.34.007. Neural Regen Res. 2012. PMID: 25337116 Free PMC article.
-
Role of the Contralesional vs. Ipsilesional Hemisphere in Stroke Recovery.Front Hum Neurosci. 2017 Sep 21;11:469. doi: 10.3389/fnhum.2017.00469. eCollection 2017. Front Hum Neurosci. 2017. PMID: 28983244 Free PMC article. Review.
-
Brain connectivity plasticity in the motor network after ischemic stroke.Neural Plast. 2013;2013:924192. doi: 10.1155/2013/924192. Epub 2013 Apr 24. Neural Plast. 2013. PMID: 23738150 Free PMC article. Review.
References
-
- Blinkenberg M,Bonde C,Holm S,Svarer C,Andersen J,Paulson OB,Law I ( 1996): Rate dependence of regional cerebral activation during performance of a repetitive motor task: A PET study. J Cerebral Blood Flow Metabolism 16: 794–803. - PubMed
-
- Butefisch CM,Kleiser R,Korber B,Muller K,Wittsack HJ,Homberg V,Seitz RJ ( 2005): Recruitment of contralesional motor cortex in stroke patients with recovery of hand function. Neurology 64: 1067–1069. - PubMed
-
- Calautti C,Naccarato M,Jones PS,Sharma N,Day DD,Carpenter AT,Bullmore ET,Warbuton EA,Baron JC ( 2007): The relationship between motor deficit and hemisphere activation balance after stroke: A 3T fMRI study. NeuroImage 34: 322–331. - PubMed
-
- Cao Y,D'Olhaberriague L,Vikingstad EM,Levine SR,Welch KM ( 1998): Pilot study of functional MRI to assess cerebral activation of motor function after poststroke hemiparesis. Stroke 29: 112–122. - PubMed
MeSH terms
LinkOut - more resources
Full Text Sources
Medical
Research Materials

